- Joined
- May 10, 2002
- Location
- Los Alamos, NM
Have run some tests to see what are dominate overclocking parameters. Results were obtained by using Rig 1 below in my sig. They aren't perfect but hopefully of some use. 
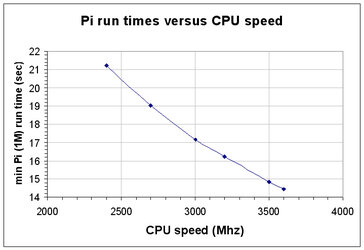
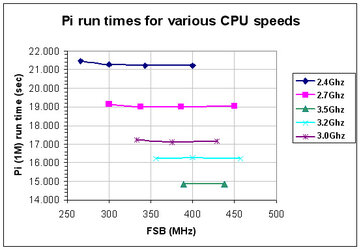
You do get higher bandwidth and performance with higher CPU speed, see figure below. There is minimal effect of the FSB speed when the CPU speed is fixed, i.e. running the northbridge faster alone doesn't provide any advantage.
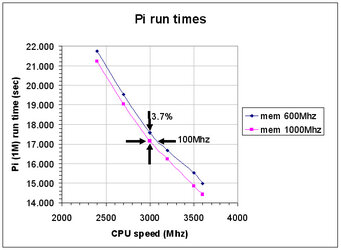
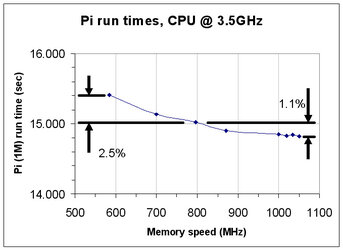
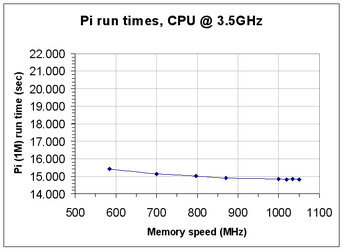
The next figure shows the gains of higher memory speed at a fix CPU speed of 3.5Ghz using Pi 1M as a metric. I kept the y-axis the same so you could see the changes relative to first plot easier. Memory timings are held constant in these studies. As you can see, higher memory speed does improve performance. But the difference between memory at 800 and 1000 is minimal, on the order of 1.5% or less (see details below).
So here is the info on memory timings. Interesting detective story associated with the initial part of investigation. The table shows results using my Mushkin that is rated at 4-5-4-11. Two sets of tests associated with memory timings are shown. One test ran Pi using 1M digits with 5 samples and the other 2M digits with 10 samples. The 1M case is often used as a reference test by a number of folks including myself.
To make a long story short, the results using 1M digits and 5 samples do not produce results that we would expect. For example 5-5-5-12 is faster than 4-4-4-11, very questionable result. However if you look at the standard deviations of the tests (called sigma in table), you see that the uncertainty associated with the numbers indicates that while the results aren't what we expect it is a reasonable result. (If you have a collection of data from a Normal Distribution then approximately 66% of the data should fall within one standard deviation of the mean.) Thus 66% of the average values would lie between 14.7689 (average - sigma) and 14.8835 (average + sigma) if I had an infinite number of tests. My result for 5-5-5-12 lies within that spread so I can't say it is wrong. Thus my metric as applied to this question doesn't appear to be good enough! You always have to make sure you're measurement reflects what you think it does.
From this point, I conclude I required a better metric to measure the effect of memory timings so decided to try Pi with 2M digits and taking 10 samples. Took half a day testing to run those cases in combo with a few "honey-do"s too. Anyway now looking at those results in the table, they are more typical of what we expect, i.e. the ordering of what is important is typical for the various settings.
So what is the maximum improvement that I might reasonably expect with better memory timings? 66% of my maximum performance improvement will be less than 1% for a single setting change to all timings, i.e. going from 5-5-5-12 to 4-4-4-11. I get this number by doing this (37.4248+.0.1108)/(37.2565-.08831)=1.0099 or 1%.
How does this relate to better memory? If I had DDR2 rated at 800 and went to memory rated at 1000 using data I've not given you but did show in the figure, (15.019+0.017)/(14.854-0.034)=1.0146 or 1.5%. Thus better (faster) memory is better, in this case 800 at 4-4-4-11 will be better than 1000 at 5-5-5-12. Of course taking bigger steps in memory speed or wider spreads in timings would have to be tested.
From these 3 sets of studies, I conclude
1) CPU speed is most important and greatest payback
2) higher memory speed is next
3) tighter memory timings (speed and timings usually compete with one another, as speed gets faster the timings get slower)
4) FSB alone has minimal value.
Anyway, those are the basics with the regions I've tested.
You do get higher bandwidth and performance with higher CPU speed, see figure below. There is minimal effect of the FSB speed when the CPU speed is fixed, i.e. running the northbridge faster alone doesn't provide any advantage.
The next figure shows the gains of higher memory speed at a fix CPU speed of 3.5Ghz using Pi 1M as a metric. I kept the y-axis the same so you could see the changes relative to first plot easier. Memory timings are held constant in these studies. As you can see, higher memory speed does improve performance. But the difference between memory at 800 and 1000 is minimal, on the order of 1.5% or less (see details below).
So here is the info on memory timings. Interesting detective story associated with the initial part of investigation. The table shows results using my Mushkin that is rated at 4-5-4-11. Two sets of tests associated with memory timings are shown. One test ran Pi using 1M digits with 5 samples and the other 2M digits with 10 samples. The 1M case is often used as a reference test by a number of folks including myself.
To make a long story short, the results using 1M digits and 5 samples do not produce results that we would expect. For example 5-5-5-12 is faster than 4-4-4-11, very questionable result. However if you look at the standard deviations of the tests (called sigma in table), you see that the uncertainty associated with the numbers indicates that while the results aren't what we expect it is a reasonable result. (If you have a collection of data from a Normal Distribution then approximately 66% of the data should fall within one standard deviation of the mean.) Thus 66% of the average values would lie between 14.7689 (average - sigma) and 14.8835 (average + sigma) if I had an infinite number of tests. My result for 5-5-5-12 lies within that spread so I can't say it is wrong. Thus my metric as applied to this question doesn't appear to be good enough! You always have to make sure you're measurement reflects what you think it does.
From this point, I conclude I required a better metric to measure the effect of memory timings so decided to try Pi with 2M digits and taking 10 samples. Took half a day testing to run those cases in combo with a few "honey-do"s too. Anyway now looking at those results in the table, they are more typical of what we expect, i.e. the ordering of what is important is typical for the various settings.
So what is the maximum improvement that I might reasonably expect with better memory timings? 66% of my maximum performance improvement will be less than 1% for a single setting change to all timings, i.e. going from 5-5-5-12 to 4-4-4-11. I get this number by doing this (37.4248+.0.1108)/(37.2565-.08831)=1.0099 or 1%.
How does this relate to better memory? If I had DDR2 rated at 800 and went to memory rated at 1000 using data I've not given you but did show in the figure, (15.019+0.017)/(14.854-0.034)=1.0146 or 1.5%. Thus better (faster) memory is better, in this case 800 at 4-4-4-11 will be better than 1000 at 5-5-5-12. Of course taking bigger steps in memory speed or wider spreads in timings would have to be tested.
From these 3 sets of studies, I conclude
1) CPU speed is most important and greatest payback
2) higher memory speed is next
3) tighter memory timings (speed and timings usually compete with one another, as speed gets faster the timings get slower)
4) FSB alone has minimal value.
Anyway, those are the basics with the regions I've tested.
Attachments
Last edited: