THOROUGH AND "SAFE" OVERVOLTING TECHNIQUE
"1.8V is the maximum safe 24/7 overvolt for your processor."
I see this, or comments like it, quite a lot. It is a common misconception that each specific type of hardware has a set-in-stone overvolt that one cannot safely exceed. This is very much untrue. No two processors are alike. Just as two ‘sibling’ processors coded one digit apart in their batch will overclock to different levels, those two ‘sibling’ processors will react differently to overvoltage.
Our hardware is unique, and needs to be treated uniquely, on a case-by-case basis. Going about this is actually quite easy, and very simple, if somewhat time consuming.
It’s all about two things. Stability, and Diminishing Returns. These two factors are the holy grails of overvolting. By paying attention to both, we can chart out and determine our specific and unique hardware’s unique "safe" 24/7 overvoltage limit.
Please keep in mind that the following is to be used as a guideline; those who are adventurous or suicidal, and those who are cautious, may respectively choose to adjust the following technique to suit their personal comfort levels. The following technique is independant of temperature and cooling – temperature is a variable which directly leads to both Diminishing returns and Instability, and as such it is taken into account, although indirectly. I am in no position to tell anyone specifically what is a "safe" temperature to run their hardware at. However, thorough use of the following guidelines will invariably leave you at a "safe" temperature by default.
First off, lets see how high we can overclock our piece of hardware, with some degree of overclock stability, using stock voltage – no overvolts just yet. Thorough stability testing is not really necessary at this point, as we are only doing some preliminary probing into our hardware’s capabilities. A quarter hour run of Prime95 or a similar stress testing program for a processor, a quarter hour run of 3DMark for a GPU/GDDR, or a quarter hour run of memtest86 test #5 for memory, is sufficient at this stage.
~ Scale your clock frequency higher in small steps. For modern processors, ~100 MHz steps are appropriate. For modern RAM, ~10 MHz steps are appropriate. For modern GPUs/GDDR, ~15 MHz steps are appropriate. The step size is not particularly important.
~ After each speed ‘step’, run a quick stability test to make sure that your overclock has some integrity.
~ When you get to the point where stability is compromised, begin to ‘fine-tune’ the overclock. Drop your speed step size, and find a rough stable overclock limit.
~ Write down the ‘final’ overclock, and the stock voltage used.
Now that we’ve done some initial probing, we can heat things up a little bit, and add some voltage. Overvolt the hardware in question by the minimum voltage increment available in the BIOS, likely 0.025V for processors, and 0.025V-0.1V for memory. If you are overvolting through use of a physical voltage modification, keep to tiny 0.025V overvolt steps. The smaller the voltage step, the more accurate our findings will be, the more time consuming the process.
~ Starting from the clockspeed we left off at after testing at stock voltages, ‘fine tune’ the frequency upwards in small steps, as before.
~ After each step, run a quick stability test to check for overclock integrity.
~ Continue untill you lose stability.
~ Once stability has been compromised, fine-tune the overclock to the absolute limit point where it can run with stability for 15 minutes.
~ Write down this rough ‘final’ overclock, and the voltage used.
We now continue with the above steps, incrementally increasing our overvoltage, and charting out the clockspeed gains which we see at each overvoltage step – go until you have completed four steps, including stock voltage. This will take some time, but it’s worth it.
After four voltage and clockspeed steps, it is time to start a graph. A piece of graph paper and a pencil, or graphing software, are all you need to do this. A chart with "VOLTAGE" for the horizontal X axis, and "CLOCKSPEED" for the vertical Y axis is appropriate. Use stock voltage as the voltage starting point, and the maximum rough stable overclock at stock voltage as your clockspeed starting point.
Chart out your results thus far. Can you see a curve yet? After four small incremental voltage and clockspeed ‘steps’, we start to get an idea of how our hardware is reacting to overvolts. Some hardware will already start to peak after four steps. Other hardware is just getting started, hungry for more. Every piece of hardware is different, which is why this graph is so important – on a piece of paper your hardware’s unique reactions to overvoltage are fully outlined.
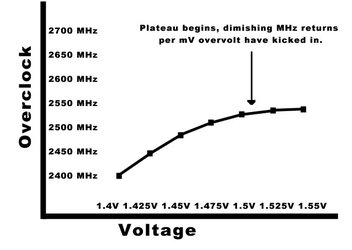
Right now is where we need to start paying attention to our gains, looking for diminishing returns. This isn’t too difficult with a graph right in front of us! When your curve begins to taper off, and flatten out, diminishing stable MHz returns per mV overvolt have kicked in. This is a good point to stop overvolting, when looking for a "safe" 24/7 overvolt and overclock.
Keeping an eye on your graph as you go, continue upwards in small overvoltage and clockspeed steps, until such a plateau becomes apparent on your graph. At this point of diminishing return, we can 'fine tune' our overclock for stability, for 24/7 use. Below, I have attached a sample graph, outlining this peak with a fictional (and conveniently clear) example.
Going slightly past the point of diminishing returns is certainly not "wrong", although the risks of both long term and short term hardware damage increase significantly when once does so. For hardcore benchmarking, suicide screenshots, and crazy fun, the graph is somewhat irrelevant. The graph guideline is an excellent tool for finding a "safe" 24/7 overclock/overvolt for your unique hardware, it is not so useful for the benchmarker or record breaker.
If your hardware sees stable MHz gains from seemingly large overvolts without peaking, do not be afraid to continue. Your hardware will tell you when it has hit its limits – it will peak or become unstable. High temperatures will directly cause both of these situations.
Overvolting far past dimishing returns will take one to the point where the negative impact of increased temperature as a result of voltage, will outweigh any gains from overvoltage in the first place. The curve will start to head downwards. When one gets to this point, they have entered the ‘death zone’.
I hope that this guide will prove useful to some of you. Please remember that all of this is merely guideline, not law - not even approaching it. It is one possible method of finding "safe" overvoltage limits, one which I have found to be extremely effective, safe, and efficient through personal experience.
Keep in mind however, that this technique is thorough and "safe", in the sense that it is based off of your unique hardware’s reactions to overvoltage. I strongly believe that this technique for finding your hardware's overvolt limit is as good as any other out there.
")
Here is a sample gains graph, with a clear point of dimishing return.


 A very imformative read - thanks!