• Welcome to Overclockers Forums! Join us to reply in threads, receive reduced ads, and to customize your site experience!

3gb after restart

Overclockers is supported by our readers. When you click a link to make a purchase, we may earn a commission. Learn More.

amossss

Registered
Joined
Feb 10, 2015
Hi

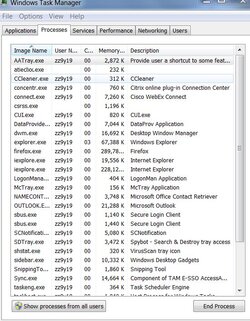
I restarted my computer. I waited for everything to load. I opened Firefox. AVG started and finished its after restart scan. Only then, I opened task manager and apparently 3-3.1gb of memory is taken according to the performance tab. I have 8GB RAM but still I wonder why and what takes so much of my RAM. Any tool that can tell me what exactly is consuming my memory? The processes tab doesn't say much because accumulating the values there, is far from what I see in the performance tab.

I know FF depends on the number of open tabs etc. but I don't want to know the specifics rather than knowing how to know what is consuming the memory (a tool, app etc)

Thanks

Update: right after posting this question, the memory jumps down to 2.5GB and I have no idea why, which strengthen my question.
 
Close background programs one-by-one until you see a big drop.

That said, with only Chrome (11 tabs) running, I'm using 5.1GB of my 16GB.
 
Close background programs one-by-one until you see a big drop.

That said, with only Chrome (11 tabs) running, I'm using 5.1GB of my 16GB.

Well, Chrome is known to be a massive memory consumer. I closed FF and it did drop to 1.8GB which is still a lot, the thing is I have nothing else to close except AVG (which can't be shut down(?) and services and startup programs which is system ones and my UPS app. This is the reason I wonder if there is a decent app that can tell me what is eating my memory.
 
Yeah, there's your usage, FireFox.

1.8gb without FF also seems a lot, in general the memory usage seems a bit high and this is why I prefer to have an application that can tell me what is taking my memory and by how much. The performance tab vs the processes tab shows a big difference
 

In what aspect were you referring to these? I'm asking because I have 2 main apps that are running, Firefox and Android Studio + VM and AVG in the background and still, it seems that after upgrading to 8gb, it's not enough for them. The 3 apps are working fast (absolutely and even more, relatively to my previous computer) so whatever the reason, the speed is OK, the problem is what is consuming my memory.

It might be Firefox leaking or something I do with Android Studio + VM makes it leak every time I debug (for example) and this is the reason I want to know which apps consumes the memory.
 
There is something really whacky going on with FF lately. I have noticed it here and at home. Even after it's shut down it's like it's running in the background. I think it's something to do with flashplayer but not sure. On occasion on the laptop ( Vista) I'll close the browser, reopen it and can't because it's already running. Have to kill it in task manager before it'll work again.
 
In what aspect were you referring to these?
In the respect of how they work. They will load into ram your most frequently used applications and keep them there until otherwise needed. So that 1.8GB idle may be SF doing its job.
 
There is something really whacky going on with FF lately. I have noticed it here and at home. Even after it's shut down it's like it's running in the background. I think it's something to do with flashplayer but not sure. On occasion on the laptop ( Vista) I'll close the browser, reopen it and can't because it's already running. Have to kill it in task manager before it'll work again.

Oh, I have this for a long time now, it stays there for some time after you close it, most of the time it shuts itself down after several seconds but sometimes it's stuck there and you really need to kill it, usually the sign for this is the cpu which is around 50% just for this process, then I know I should kill it.

I have this and Android studio, one of them might be the source but in order to know what, I need to know what is consuming my memory and I didn't find a decent application that does that.

In the respect of how they work. They will load into ram your most frequently used applications and keep them there until otherwise needed. So that 1.8GB idle may be SF doing its job.

Could be but in order to be sure of that, I'd be glad to have an application that really shows me what consumes how much of the memory :)
 
Last edited by a moderator:
I take it you just installed the 8g sticks and this was your first boot since installing them? I say this cause when you only have 4g ram the system is limited on how much it loads on boot, lets just say 15% of your memory will always be used up by the system and its needs, when you have only 4g it can only use 600MB, but if you have 8g it can now load up to 1.2g of memory for the system files it thinks it will need, other programs do the same thing.

Open task manager and click on the performance tab, click on resource monitor and in that new window check out the memory tab, it should show you just about all the processes that are running on your pc and how much memory they each use.
 
Open task manager and click on the performance tab, click on resource monitor and in that new window check out the memory tab, it should show you just about all the processes that are running on your pc and how much memory they each use.

How can I check how much memory each of them use in the resource monitor?
 
Right, that's the processes tab but the total sizes of these do not match the one I see in performance tab, that's the problem to begin with :) as I mentioned in my original post.

I thought the resource monitor has a more comprehensive information about tasks.
 
Right, that's the processes tab but the total sizes of these do not match the one I see in performance tab, that's the problem to begin with :) as I mentioned in my original post.

I thought the resource monitor has a more comprehensive information about tasks.

Did you hit "Show processes from all users"?
 
Did you hit "Show processes from all users"?

I forgot all about that checkbox :bang head

You might be able to answer this ATM (might be useful for others reading this also). When looking at resource monitor you see the different categories of memory the Shareable and Private are added to get Working, but Commit is what (I honestly don't know)? Working is what's being used? and Commit is what actually on the ram module? So IE shows 242000KB commit and Working Set of 314000KB (rounded numbers from my system right now) how much ram is actually taken up by IE? or is it not that cut and dry and it's some variation of commit, shared, private or working set? I'm curious, I will have to look this up anyways. But if you add all the processes memory used up it doen't equal the amount of ram that the system claims is being used.

Edit: never mind, I found out why, the system has reserve space, and it also has standby, which if I'm not mistaken is the Commit memory that is data not currently in use (also says that in the pop-up bubble).
 
Did you hit "Show processes from all users"?

Ofcourse. I wonder if there is an app (or maybe it is hidden in the task manager) where I can select a process and it will tell me how much memory it is consuming right now. Resource monitor seems to be more comprehensive but still its values are totals and not based on processes.
 
Back