• Welcome to Overclockers Forums! Join us to reply in threads, receive reduced ads, and to customize your site experience!

FRONTPAGE UL Benchmark Launches CPU Profile Benchmarking Software

Overclockers is supported by our readers. When you click a link to make a purchase, we may earn a commission. Learn More.

Overclockers.com

Member
Joined
Nov 1, 1998
Yesterday, UL Benchmark added CPU Profile to their 3DMark Advanced and Professional Edition benchmarking software. CPU Profile runs six tests on the CPU determining 1, 2, 4, 8, 16, and maximum threads to provide a comparative rating to other CPUs. If you currently own a copy of 3DMark Advanced Edition it is currently available as a free update. If you would like to purchase this useful tool you can buy it from Steam for only $4.49 until July 8th, 2021. The press release below has additional details along with links.

Click here to view the article.
 
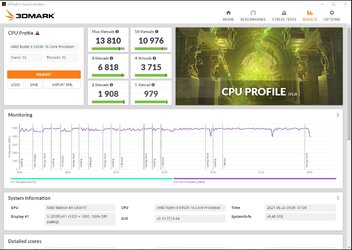
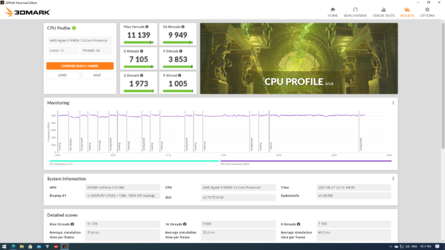
I'm away from home so can only run it on my laptop with a Zen 3 5800H mobile CPU, with 8 cores 16 threads.

cpuprofile.png
Link to web results: http://www.3dmark.com/cpu/16620

Well, I get some numbers. How those numbers compare will have to wait until I get home next week.

As is, the bench results may be slightly skewed by thermal and/or power limits. It starts off at higher thread counts and works down. At the start, the CPU may be cooler and thus have less thermal effects early on. Likewise time based power budgets will be consumed early on and may give a boost in that area.

1 to 2 threads: 1.93x
2 to 4 threads: 1.92x
4 to 8 threads: 1.69x
8 to 16 threads: 1.17x

Looking at score scaling with increasing threads. We seem to get near ideal scaling from 1 to 4 threads, with a little overhead somewhere. 4 to 8 threads is a smaller jump. It will take more work to try and determine if this is due to software scaling overheads or is a hardware resource limitation. For example, this might be determined by running an 8 core CPU at a fixed lower clock. This will reduce the loading on non-execution hardware resources. If this scales better than expected, it is hardware. If it doesn't change in scaling, it is software limiting. 8 to 16 threads on an 8 core system is indicative of how much benefit SMT gives. 17% is a pretty unremarkable value, assuming it is not hardware limiting.

Open questions:

What is the benchmark effective peak IPC on Intel vs AMD CPUs?
Is it strongly affected by cache sizes, speeds, memory bandwidth/latency?
How co-dependant are the threads to each other? For example, 1 task using 8 threads is different from 8 independent tasks using 1 thread each.
 
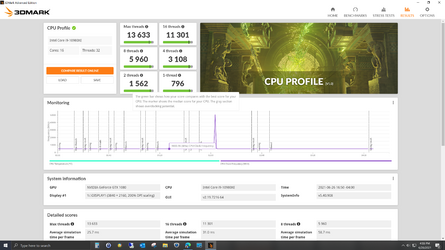
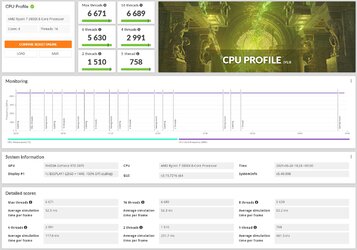
Here's my 5950X using the CTR OC tool.

3DMark CPU.JPG

1 to 2 threads: 1.95x
2 to 4 threads: 1.95x
4 to 8 threads: 1.84x
8 to 16 threads: 1.61x
16 to 32 threads 1.26

Maybe you do have some throttling going on Mac. My SMT gave about 26%
 
Maybe you do have some throttling going on Mac. My SMT gave about 26%

I forgot something important, that CPUs will generally boost differently depending on how many cores are in use. That is, 1 core active will generally run at a higher clock than 2, and so on. That might better explain the not so ideal scaling I saw. Also, I need to monitor the CPU power during these runs. Might be hitting a power limit on higher core usage. I don't have a 2nd monitor on laptop so doing this live isn't practical. I know there are overlay software but I'm not set up for those.

Also mine is the mobile Zen 3, so I only have half the L3 cache/core compared to the desktop versions.

Once I'm home it will be easier to test these by using fixed clocks which takes out a bunch of variables.
 
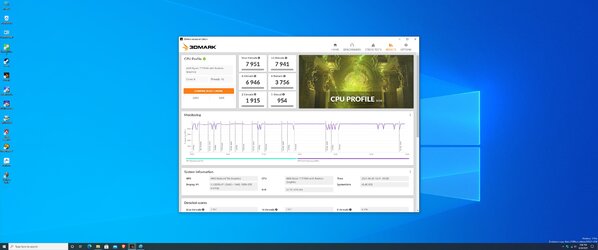
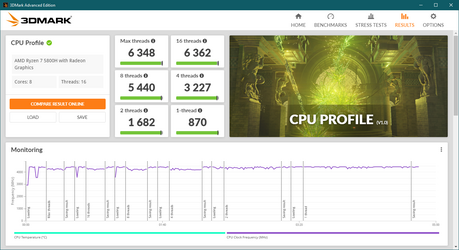
In looking at the discrepancies in scores vs threads- you can see that from 1core to 2 then to 4 then to 8, that they do scale closely. What you can see is that 1 and 2 core seem to be higher clocks vs 4 and 8 core. Once over 8 core on the cpu's that have been shown in this thread, that a thread vs a core have a substantial ability difference. I have heard it said that a thread is only about 30% as abled as a core. 3dcpu.jpg I will also state that this is my r7 5700g with pbo in a mini itx case
 
I have heard it said that a thread is only about 30% as abled as a core.

Presuming you're talking about having SMT/HT vs not, it varies a lot depending on the workload. For Prime95 it is 0%. It does not benefit from it, and actually makes things worse because power consumption increases. I forget the exact number but Cinebench R15/R20 is around 30%, so maybe that's where the number comes from. However this is a relatively good case. I don't know what the average is if you were to pick a lot of varied workloads, but I'd expect it to be lower than 30%.

There are some interesting outliers. I've seen 50% twice, once in a long retired distributed computing project, and the Blender Ryzen benchmark with the software version at the time. And the all time record that I'm aware of are some of the subtests in 3DPM base version. That isn't heavily optimised but I saw some 80% uplift on that. The AVX-512 optimised version isn't public as far as I'm aware but it gained massive increases from that. I had thought about it as improving execution resource, but the new understanding is optimally getting data around can be a limit, and that's what's probably going on in this particular case.
 
you can see the change from when you have no more cores and have to rely on HT. Look at the r9 5950x vs my 5700g, it scales pretty much as expected until I run out of cores at 8 count where the 5950 makes a nice jump even at 16 threats
 
That's normal what you see, 30-50% depending on workload. P95 isnt something people play so.. scaling there may nkt apply anywhere else. :)
 
That's normal what you see, 30-50% depending on workload. P95 isnt something people play so.. scaling there may nkt apply anywhere else. :)

People don't play Cinebench either. You can equally say Cinebench doesn't represent scaling elsewhere. Different niches. If you were to average a wide variety of workloads, I'd bet it is less than 30% benefit. Implication: most software scales less well than Cinebench. 50% can happen but is rare. Prime95 is heavily optimised to make use of execution resource thus it doesn't need it to extract potential performance.

Example of my previous testing at link below. You may note the choice of tests performed as mostly being synthetic or niche compute so arguably that wont represent everything either.

https://linustechtips.com/topic/985591-skylake-vs-zen-vs-zen-htsmt/
 
Cinebench is a stand alone benchmark for CPU/GPU rendering... more of a real world activity than searching for Prime numbers (unless your work matters on the math to do so, of course :)).

Blender scales well with threads.. there are many applications that scale well (that 30-50%) with it. I believe Anand and TPU (maybe Tom's) test SMT/HT scaling across a variety of apps. It's been tested before. The short of it is, as was said, scaling varies dramatically, it just depends on the app. But it's common to see notable gains (sometimes losses, but those are exceptions). :thup:

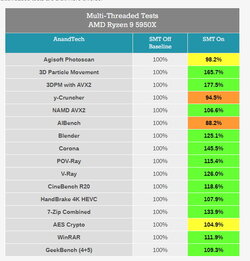
EDIT: https://www.anandtech.com/show/1626...-multithreading-on-zen-3-and-amd-ryzen-5000/2

If my math is right, that's an average of 20% across all of those applications. With 1/4 of them well over 30% increase. Just depends on the sofwware being used and what's being done. :thup:

1.jpg
Starting with the two tests that scored statistically worse with SMT2 enabled: yCruncher and AIBench. Both tests are memory-bound and compute-bound in parts, where the memory bandwidth per thread can become a limiting factor in overall run-time. yCruncher is arguably a math synthetic benchmark, and AIBench is still early-beta AI workloads for Windows, so quite far away from real world use cases.

Most of the rest of the benchmarks are between a +5% to +35% gain, which includes a number of our rendering tests, molecular dynamics, video encoding, compression, and cryptography. This is where we can see both threads on each core interleaving inside the buffers and execution units, which is the goal of an SMT design. There are still some bottlenecks in the system affecting both threads getting absolute full access, which could be buffer size, retire rate, op-queue limitations, memory limitations, etc – each benchmark is likely different.

The two outliers are 3DPM/3DPMavx, and Corona. These three are 45%+, with 3DPM going 66%+. Both of these tests are very light on the cache and memory requirements, and use the increased Zen3 execution port distribution to good use. These benchmarks are compute heavy as well, so splitting some of that memory access and compute in the core helps SMT2 designs mix those operations to a greater effect. The fact that 3DPM in AVX2 mode gets a higher benefit might be down to coalescing operations for an AVX2 load/store implementation – there is less waiting to pull data from the caches, and less contention, which adds to some extra performance
.
 
If my math is right, that's an average of 20% across all of those applications. With 1/4 of them well over 30% increase. Just depends on the sofwware being used and what's being done. :thup:.

So based on those numbers the average is closer to 20%, not the 30-50% you earlier stated? That was my main point.

I agree that SMT/HT does generally give gains, but it is not helpful to over-state it. I will still argue that Cinebench is no more representative to regular users than Prine95 is. Cinebench in the enthusiast world is little more than a numbers game. How many people that run Cinebench have ever used Cinema 4D in a serious way? I have no solid numbers but think it fair to assume it is a miniscule minority. You might argue it relates indirectly to other rendering apps, but why not directly test those if you were interested in them. In contrast, those running Prime95 bench are likely to be using Prime95 and similar software which uses the same codebase and behaves similarly. Over 98% of the currently known top 5000 largest prime numbers credit using software using the same math library as Prime95. I'd agree it is not software for the masses, but there are many obscure use cases so to single it out is unfair.

If you argue Prime95 is niche, how niche is 3DPM? It's based on Ian Cutress' PhD work in computational chemistry. It gets counted twice in that table because there's two code path versions of it. It would be 3 if AMD supported AVX-512.

Also that y-cruncher decrease was unexpected. I think I pinged the author at the time. Don't know if anything came from it.


Anyway, this is getting a little sidetracked from CPU Profile. As a new bench I'm still seeking to understand it better. What affects it? What doesn't? As it supports both fewer and more threads, it gives a wider picture, although how we interpret it is a learning process.
 
I wasn't saying everything on there is common. Just that most are arguably more useful than the data p95 yields since it doesn't really translate to anything directly (right?).

30-50 as an average is overstating it a bit (still within a range)...but its clear there are notable gains in most apps... ones that do better extrapolating to real world workloads. :)

I single it out because it's a stress test for most people who use it. Fewer people grinding searching for prime than render, encode, compressiom/decomp, etc. What's related to it that the masses use where it's useful to a large subset of people? I ask not to be smart, but to see what im missing. :)

I digress. :)
 
As a workload Prime95 is best characterised as FP64 heavy, that in many cases work on a dataset greater than can be held locally in CPU, and as such memory performance plays a part also. It is either execution resource limited, or memory bandwidth limited. In either case, HT/SMT doesn't provide any useful benefit. The only other well known but unrelated application that might share similar characteristics is linpack. You could argue both of these are more in the mathematical realm that is outside of most users, but probably a bigger group than computational chemistry (3DPM). I have long feared that my interests in computing lean more towards HPC type configurations than consumer in order to get best performance.

I suppose that is a partial explanation of my thinking. I like to understand how performance dependant software behaves, even if through higher level observation and not a low level understanding. Cinebench has historically scaled so well you can easily predict scores knowing only the cores, clock, and an architecture dependant scaling value. I did most of that in R15 era, but R20 seems to be much the same with different scaling numbers. Prime95 benchmark can be used to infer optimal performance configuration in other similar software, since you want to balance workload to maximise execution potential. y-cruncher is fun because although it is a heavy load at times like prime95, it is more varied so it is still benefiting somewhat from HT/SMT and a bursty ram requirement, that's not something I can predict.

So now we have another new bench I hope will provide a platform to explore core scaling more easily.


Random thought: without checking, I wonder if the Anandtech test was performed at fixed power limit. In theory if code does not benefit from HT/SMT, it would still be subject to power draw from providing such. Thus the useful work has lower effective power budget after providing the non-beneficial HT/SMT. I believe there have been reports of similar when running XMP ram. For workloads that don't benefit from it, the extra power required to drive faster ram leaves less for the cores. In my testing I like to perform it at fixed clocks, unlimited power, since that gives a more direct comparison of changing one variable: HT/SMT. I like to work on peak architecture scaling, whereas mainstream reviews tend to focus on product/platform level testing. The latter is arguably more useful to a user but not for understanding the underlying behaviour where the former is preferred.
 
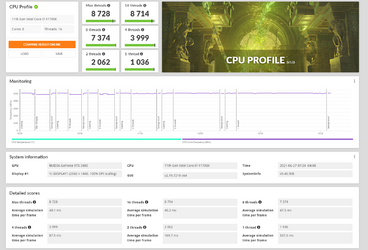
I still don't know if this is good or bad or whatever ? Maybe add a comparison to stock directly into the benchmark like the others ?

CPU Profile.jpg
 
I still don't know if this is good or bad or whatever ? Maybe add a comparison to stock directly into the benchmark like the others ?

If you look on the bars, you see a black line. If your green bar passes that, your system is above median.

To recap, the median is if you take all the results and sort them into order, then you pick the middle one. This is not the same as an average (mean) as it resists skewing by outliers better. I suppose the assumption they have is that most people will run at something like stock, and that becomes the black mark. If there's something wrong with the system to cause it to score much lower, or if it is overclocked to score higher, it will have little effect on the median.

I further assume they don't want to hard code a stock value in since this is a system level test of sorts, so it doesn't fully isolate the CPU. As such even stock scores could vary a bit.
 
I want to play :clap: I found out my i9-7980xe was not busted :cool: I was retesting it on my EVGA x299 dark with memory set to 4000@12-12-28. I got to 4.3GHz 18c/36t and my Corsair HX-1050 decides to go out in a cloud of smoke:facepalm: Does it use that much power? The video card was not OCed. It was also ~ itÂ’s 7yr warranty:chair:
 
Provisional observations testing various CPU and ram combos on 10600k: CPU Profile is the gamer Cinebench.

Practically no variation in scores with ram clocks. Seems to scale directly with CPU clock. Tried core form 2.4 GHz to max turbo of 4.8, ram from 2400 to 4000. Scores varied within 1% after clock normalisation under all of those. HT benefit was 18%.

I'm about to run some different Intel cores and see how that behaves. I've only got one modern AMD system which is the laptop I mentioned earlier, so I'll need to rerun that to try and extract a bit more running detail that is not saved on the web scores.
 
Back