- Joined
- Mar 7, 2008
Apologies for the large images. If I made them smaller they might not be visible. Charts best viewed 100% on 1080p or higher pixel width screen...
This is a test I wanted to do for a while, and it is really time consuming, so I've only tested 3 examples. The goal is to look at how the architecture behaves, somewhat independent of clock and number of cores. I chose to use the three systems below, and in all cases limit them to 2 cores at 3 GHz only. The only thing I changed beyond that was turning HT/SMT on or off, so I can see its difference. 2 cores was chosen as it is the practical lowest I can set on the CPUs. By reducing the cores/clocks somewhat, any other limiting factors elsewhere in the system will become less so. While I haven't proved it is the case, the ram bandwidth should be practically unlimited for the purposes of this testing, although latency may still have some impact.
Test systems:
Skylake should still be adequate to representing current Intel CPUs, as outside of some specific new instructions, the architecture essentially hasn't changed. The two AMD CPUs represent Zen and Zen+, the latter was supposed to have had some optimisations applied leading to reported small gains.
I would note the 2600 system offered me the choice of running CCX cores as 1+1 or 2+0. I chose 1+1 as kinda more representative of the typically offered configuration, although I later saw that all cores on one CCX performed better for gaming. This testing wasn't for gaming though. The CCX configuration may be something to follow up later.
Cooling shouldn't matter, at the reduced cores/clocks none of them were anywhere near throttling, and there's no variable clocks from turbo to worry about. All systems had the same G.Skill TridentZ 3000C14 (B-die) 2x8GB ram fitted for dual channel operation. Ram was set to use XMP (or whatever it is called on AMD boards) with the minor observation on the 1800 system, that would pick 2933 by itself, and I had to manually select 3000 to match the other systems. Timings were 14-14-14-34, 2T on Intel system, 1T on AMD systems. Operating system used was Windows 7.
Tests used:
Each test was run a minimum of 3 times. The best result obtained is the one used. My thinking is, there may be things that slow down a test making it less than ideal, but there isn't anything that would make it better than it is. By repeating the runs and choosing the best one, we should converge towards the best case.

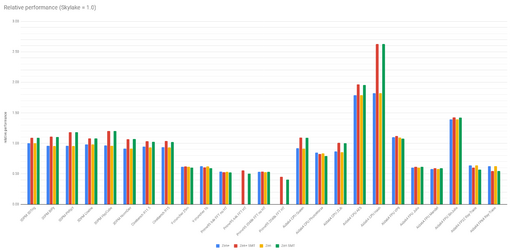
This is a relative performance showing how Zen/Zen+ compares against Skylake, with and without HT/SMT comparing like for like. Below 1.0 is worse than Skylake, exactly 1.0 is the same, and over 1.0 is faster than Skylake. It has been widely discussed that Zen in general has lower single thread performance, and the HT/SMT off results show that generally it is slightly below 1.0. AMD's SMT is also stated as generally being better than Intel's, and again, we can see that they tend to be higher than Intel.
There are two groups which differ significantly. Y-cruncher, Prime95, and some of the Aida64 tests are down to the 0.6 ball park. These tests probably feature AVX heavily, and Zen in general only has about half the potential of a recent Intel. Not all code will be that, so it wont be the full drop to 0.5 necessarily. On the other side, AES and Hash are much higher than with Skylake. I have heard but not verified AMD put in specific elements to enhance performance in those areas.
For clarification, there are three states tested for Prime95:

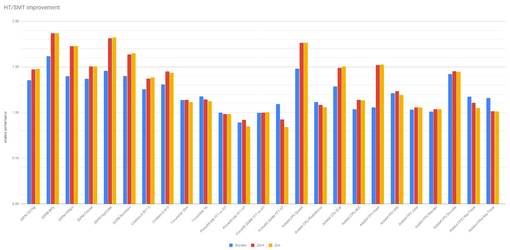
On to the main purpose of this test, this is the improvement from turning on HT/SMT compared to not. I used to think that on Intel CPUs, the improvement was from 0 to 50%. This is not the case, as 3DPM BiPy allows it to go slightly over that. These results do show that AMD SMT does generally give a bigger boost than Intel HT, with some exceptions.
Prime95 may be considered a special case, especially for the smaller FFT size, as the overhead of implementing extra threads takes away performance. It requires a bigger size to efficiently split the work. I don't know why there would be a drop from SMT for AMD in that scenario.

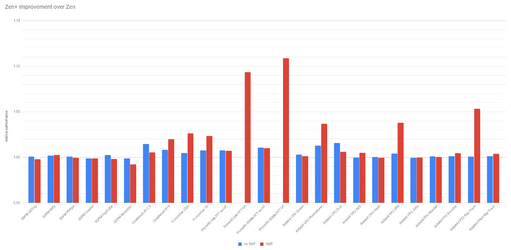
And finally, this is a comparison of how Zen+ compares to Zen, so again, above 1.0 means Zen+ is better than Zen. It helps in some areas, like the three Aida64 subtests where it gains 4-5%. and 2-3% for Cinebench. You might also see the two big spikes for Prime95. I would caution there, while it is a big improvement, the absolute performance means those scenarios are not ones that likely would be used in practice. Running other configurations were faster. It only means that configuration was less bad than it was before.
This is also a good example why the 13%/16% number that is thrown around for Zen 2 should be taken with caution. Results can and do vary with the task at hand. Maybe there will be specific tasks that will have that benefit, but we can't assume it will be universal.
This is a test I wanted to do for a while, and it is really time consuming, so I've only tested 3 examples. The goal is to look at how the architecture behaves, somewhat independent of clock and number of cores. I chose to use the three systems below, and in all cases limit them to 2 cores at 3 GHz only. The only thing I changed beyond that was turning HT/SMT on or off, so I can see its difference. 2 cores was chosen as it is the practical lowest I can set on the CPUs. By reducing the cores/clocks somewhat, any other limiting factors elsewhere in the system will become less so. While I haven't proved it is the case, the ram bandwidth should be practically unlimited for the purposes of this testing, although latency may still have some impact.
Test systems:
- 6700k, Asus Maximus IX Apex bios 1301
- 2600, Asrock B450 gaming ITX/ac bios P1.20
- 1800, Asus Prime X370-Pro bios 4012
Skylake should still be adequate to representing current Intel CPUs, as outside of some specific new instructions, the architecture essentially hasn't changed. The two AMD CPUs represent Zen and Zen+, the latter was supposed to have had some optimisations applied leading to reported small gains.
I would note the 2600 system offered me the choice of running CCX cores as 1+1 or 2+0. I chose 1+1 as kinda more representative of the typically offered configuration, although I later saw that all cores on one CCX performed better for gaming. This testing wasn't for gaming though. The CCX configuration may be something to follow up later.
Cooling shouldn't matter, at the reduced cores/clocks none of them were anywhere near throttling, and there's no variable clocks from turbo to worry about. All systems had the same G.Skill TridentZ 3000C14 (B-die) 2x8GB ram fitted for dual channel operation. Ram was set to use XMP (or whatever it is called on AMD boards) with the minor observation on the 1800 system, that would pick 2933 by itself, and I had to manually select 3000 to match the other systems. Timings were 14-14-14-34, 2T on Intel system, 1T on AMD systems. Operating system used was Windows 7.
Tests used:
- 3DPM v2.1 - written by Ian Cutress who's main job is as editor at Anandtech. I have no idea what it does or represents, but it gives some interesting HT/SMT scaling numbers. I only use the subscores here.
- Cinebench - because everyone loves it as a benchmark, regardless if they use whatever it is representing. I used both R11.5 and R15.
- Y-cruncher 0.76.9487 - I find this an interesting benchmark, as it is optimised to make use of CPU facilities in doing the Pi calculations. Sizes tested were 25m and 1b, which are the ones used by hwbot.
- Prime95 29.4 build 8 - this is the current release version, and again is well optimised to use whatever performance a CPU has to offer. Tested at two FFT sizes: 64k and 2048k, with and without HT in software separately from system setting.
- Aida64 5.98.4800 - this has a whole bunch of tests so why not do them too? I'd comment for now past experience suggests that PhotoWorxx is a ram bandwidth intensive test. I don't know if my configuration here is enough to negate its impact from the CPU performance itself.
Each test was run a minimum of 3 times. The best result obtained is the one used. My thinking is, there may be things that slow down a test making it less than ideal, but there isn't anything that would make it better than it is. By repeating the runs and choosing the best one, we should converge towards the best case.

This is a relative performance showing how Zen/Zen+ compares against Skylake, with and without HT/SMT comparing like for like. Below 1.0 is worse than Skylake, exactly 1.0 is the same, and over 1.0 is faster than Skylake. It has been widely discussed that Zen in general has lower single thread performance, and the HT/SMT off results show that generally it is slightly below 1.0. AMD's SMT is also stated as generally being better than Intel's, and again, we can see that they tend to be higher than Intel.
There are two groups which differ significantly. Y-cruncher, Prime95, and some of the Aida64 tests are down to the 0.6 ball park. These tests probably feature AVX heavily, and Zen in general only has about half the potential of a recent Intel. Not all code will be that, so it wont be the full drop to 0.5 necessarily. On the other side, AES and Hash are much higher than with Skylake. I have heard but not verified AMD put in specific elements to enhance performance in those areas.
For clarification, there are three states tested for Prime95:
- System HT/SMT off
- System HT/SMT on, not used in software (real cores only)
- System HT/SMT on, used in software

On to the main purpose of this test, this is the improvement from turning on HT/SMT compared to not. I used to think that on Intel CPUs, the improvement was from 0 to 50%. This is not the case, as 3DPM BiPy allows it to go slightly over that. These results do show that AMD SMT does generally give a bigger boost than Intel HT, with some exceptions.
Prime95 may be considered a special case, especially for the smaller FFT size, as the overhead of implementing extra threads takes away performance. It requires a bigger size to efficiently split the work. I don't know why there would be a drop from SMT for AMD in that scenario.

And finally, this is a comparison of how Zen+ compares to Zen, so again, above 1.0 means Zen+ is better than Zen. It helps in some areas, like the three Aida64 subtests where it gains 4-5%. and 2-3% for Cinebench. You might also see the two big spikes for Prime95. I would caution there, while it is a big improvement, the absolute performance means those scenarios are not ones that likely would be used in practice. Running other configurations were faster. It only means that configuration was less bad than it was before.
This is also a good example why the 13%/16% number that is thrown around for Zen 2 should be taken with caution. Results can and do vary with the task at hand. Maybe there will be specific tasks that will have that benefit, but we can't assume it will be universal.
