-
Welcome to Overclockers Forums! Join us to reply in threads, receive reduced ads, and to customize your site experience!
You are using an out of date browser. It may not display this or other websites correctly.
You should upgrade or use an alternative browser.
You should upgrade or use an alternative browser.
FEATURED Marathon Season VII September: PCMARK 07
- Thread starter Johan45
- Start date
- Joined
- Mar 7, 2008
I often look at the hwbot rules to see what could be tweaked. Was LOD done? It's something I'm not looking forward to doing later if I even bother at all. Also, I don't know how this bench behaves, but if it doesn't use more than 16 threads I'd turn off HT. Don't know if the screenshot is showing the actual cache speed or if it downclocked at the time, but certainly turn it up if not already done. I've settled on 3000 on my 7800X. Think Woomack got a bit further with whatever CPU he was running at the time.
I will look into cache tweaks as that was left at stock. THat is a good point I thought of as well with disabling HT and getting more CPU speed. The bench is from 07 so I have no idea the max threads it can handle. Clearly not 32. 
Pretty sure we can dig down and see it on the free version. At least there were details of something I was looking at before I posted, LOL!I think you have to buy it to see individual test scores
- Joined
- Mar 7, 2008
If you go to the online result you can expand the subtests and see the values in that.
For convenience:
ED: https://www.3dmark.com/pcm7/1160664#
bmwbaxter: https://www.3dmark.com/pcm7/1160585#
mackerel: https://www.3dmark.com/pcm7/1160718#
I'm also curious about these, but it'll have to wait a bit before I can manually pull the numbers
Note on the free version, you can only save one result online. I had to delete my 1st one before it would save my 2nd run. My above link may not work if I submit another result after OC GPU.
- Joined
- Mar 7, 2008
I think it might have something to do with the security feature in Ryzen. When tesing against Intel Ryzen smokes them in the AIDA AES/HASH tests and there is a security part to this benchmark IIRC. Also spectre/meltdown patches hurt Intel on storage a bit.
Besides AMD Ryzen just rocks
Web browsing and decrypting / Data decrypting
ED: 264.53681 MB/s
bmwbaxter: 1501.97142 MB/s
mackerel: 320.31313 MB/s
How much it is weighted overall is another matter.
- Joined
- Dec 19, 2012
- Thread Starter
- #30
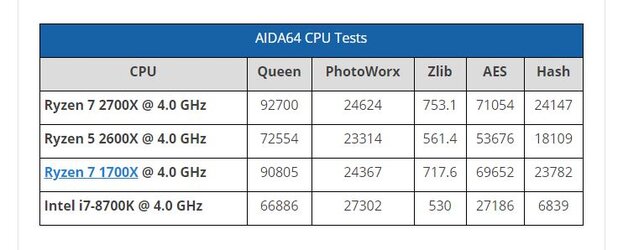
It shouldn't matter too much which you use Mack, they both had huge advantages over intel in that area with 2xxx series only slightly ahead because of cache improvements.
Taken from my review https://www.overclockers.com/amd-ryzen-7-2700x-and-ryzen-5-2600x-cpu-review/
Check the last two columns shows the big lead AMD has over Intel in that area

Taken from my review https://www.overclockers.com/amd-ryzen-7-2700x-and-ryzen-5-2600x-cpu-review/
Check the last two columns shows the big lead AMD has over Intel in that area
- Joined
- Mar 7, 2008
Ok, but I'm still going to be trading off Ryzen's advantage in that sub-test, vs the overall performance. The only OC 8 core I have is the 1700, and while I think I had it bench stable to 4.0 before, the cooling on it isn't so great at the moment so I'm not confident of repeating that. 8x3.9 near enough = 6x5.2 if we assume IPC per task is equal, which it isn't. Ryzen might take that sub test by some margin, but what about other tests?... I'll have to have a poke around the scores we have already, and come up with some IPC like estimate and see if that gives a bigger picture.
- Joined
- Mar 7, 2008
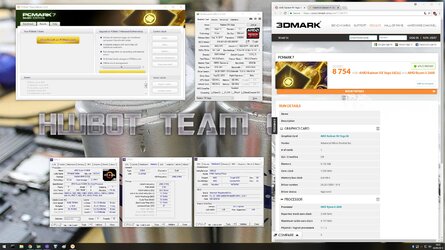
mackerel/R5 2600/air/8754
Since it was around I just did the [email protected] with Vega 56 stock. SATA SSD.
Who has a ThreadRipper they can run this on?

Since it was around I just did the [email protected] with Vega 56 stock. SATA SSD.
Who has a ThreadRipper they can run this on?
Last edited by a moderator:
- Joined
- Dec 19, 2012
- Thread Starter
- #34
mackerel/R5 2600/air/8754
Since it was around I just did the [email protected] with Vega 56 stock. SATA SSD.
Who has a ThreadRipper they can run this on?
View attachment 201039
With luck I should have one by the end of the week. Monday at the latest. Got a smokin deal on 1950x and ASUS ROG Zenith
- Joined
- Mar 7, 2008
I've done runs on [email protected] + Vega 56 (8754), [email protected] + 1080Ti (8944), [email protected] +980Ti (7455 overall). Also comparing with ED's [email protected]+1080, and bmw's [email protected]+1080 runs.
The free version seems to have 9 unique tests. They repeat in the different categories so it looks like there are more.
Image manipulation: my 8086k ran away at 34 Mpix/s, the 2600 and 7960X at 28, other two at 26. It really doesn't like Skylake-X, and may prefer clocks over core but would need more results to get a clear picture.
Web browsing: This is more Intel leaning. 7960X leads on 26, closely followed by 8086k at 25. 7800X at 21. 2600 down at 16, and 15 for 2700X. Again, hinting clocks over cores for Ryzen. Intel side, again seems like Skylake-X does relatively poorly compared to 8086k.
Data decrypting: Easy Ryzen win here, although again my 2600 is slightly faster than the 2700X. Ryzens 1500+, 8086k at 320, 7800X at 293, 7960X at 265. Yet again hinting clocks matter more than cores.
Video playback: all scores were practically identical at 24fps.
Video downscale: I don't know what to make of this. Is it just CPU or use GPU too? 7960X top at 28k, 8086k at 25k, 2700X at 22k, 2600 at 20k, 7800X at 14k. I'm not sure if it is CPU, since the 7960X system does take the lead, over my 8086k with arguably faster GPU. But the 7800X just falls way behind.
DX9 graphics: Again I suspect a mixture of CPU and GPU influence here. 8086k+1080Ti tops at 163 fps. 7960X+1080 at 154 fps. 7800X+980Ti at 126 fps. 2700X+1080 at 112 fps. 2600+Vega56 at 98fps. Kinda like gaming, the GPU is important but at high fps, the CPU also plays a significant factor. This may contribute to the Ryzens falling behind here even when paired with a strong CPU.
I'm not going to cover the disk benches as I didn't pay attention to who used what exactly. There's about 20% spread between slowest (my 2600+SATA SSD) and fastest (my 8086k+Optane) with the others I believe all with NVMe in between.
We don't know the weighting of the subscores, but its obvious there is a bit of give and take depending on the test. With data decrypting specifically, there is ball park 5x subscore advantage on Ryzens so they probably get a good overall boost from that.
- Joined
- Apr 14, 2011
https://www.3dmark.com/pcm7/1160965
If you check my profile, you should see a little over 40 soon. I cannot figure out this benchmark. Its like i want to hit 8800 but i cant. Raise it up higher and results start to drop. i used valley to help me overclock the gpu but then i notice that sometimes ill go from 177 fps max back down to 150 again. I dont know what i am doing wrong here in overclocking this 1080ti. I feel lost.
If you check my profile, you should see a little over 40 soon. I cannot figure out this benchmark. Its like i want to hit 8800 but i cant. Raise it up higher and results start to drop. i used valley to help me overclock the gpu but then i notice that sometimes ill go from 177 fps max back down to 150 again. I dont know what i am doing wrong here in overclocking this 1080ti. I feel lost.
- Joined
- Apr 14, 2011
Frick yes
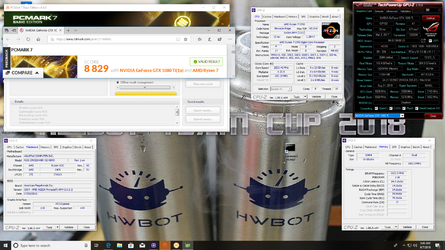
(G{in}[AK)TION]/ Ryzen 2700/ AIO COOLER / 8829
http://www.3dmark.com/pcm7/1160993

Its 3am which means...
(G{in}[AK)TION]/ Ryzen 2700/ AIO COOLER / 8829
http://www.3dmark.com/pcm7/1160993
Its 3am which means...
- Joined
- Mar 7, 2008
I've had a go at breaking down how the overall score might use the subscores. I took 5 of the results posted on this thread, and fiddled with weightings, assuming each subscore multiplied by a weighting, then summed would give the overall score. I found a set of value that was accurate to around 1%. Note there are 9 variables, and from my long faded maths lessons, when dealing with finding unknown variables (simultaneous equations) you need as many cases as unknowns. I did not meet that here, so there may be alternate weightings that also work. In other words, there may be multiple solutions, not just this one. I suppose as a test, I could simply pick a few more results not used in the training, and see if they continue to work. I've only done that with one extra result of mine, that is not so different from another one, so it may be of limited value.
With that disclaimer out of the way, here are the results:

Here I stacked the subscores, as one way to visualise how the subscores contribute. Not sure it shows much, other than the decryption difference between Ryzen and Intel.

How about comparing by subscore? A bit more telling. I wont write too much here but once again, the decryption is a big difference.
In case anyone else wants to play, the scaling factors I used are a follows:
Image manipulation 35.26
System store - importing pictures 25.42
Web browsing 36.08
Data decrypting 1.23
System storage - Windows defender 106.6
Video playback 52.48
Video downscale 0.041
System storage - gaming 63.96
Graphics DX9 8.2
With that disclaimer out of the way, here are the results:
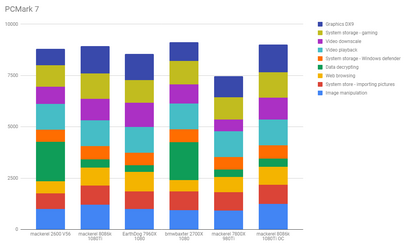
Here I stacked the subscores, as one way to visualise how the subscores contribute. Not sure it shows much, other than the decryption difference between Ryzen and Intel.
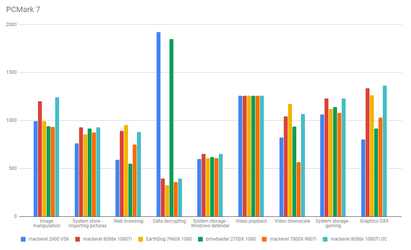
How about comparing by subscore? A bit more telling. I wont write too much here but once again, the decryption is a big difference.
In case anyone else wants to play, the scaling factors I used are a follows:
Image manipulation 35.26
System store - importing pictures 25.42
Web browsing 36.08
Data decrypting 1.23
System storage - Windows defender 106.6
Video playback 52.48
Video downscale 0.041
System storage - gaming 63.96
Graphics DX9 8.2
Similar threads
- Replies
- 40
- Views
- 4K
- Replies
- 27
- Views
- 2K
- Replies
- 33
- Views
- 2K
- Replies
- 15
- Views
- 1K
- Replies
- 80
- Views
- 84K
