I had a good lm-sensors setup before but I was forced to reinstall my system, so I completely forgot how to read my temps. Things I want to know are:
What is my socket temp? What's my core temp? I have an AMD FX6300 on a ASUS M5A99FX Pro R2.0. I found this but I still don't really get it there seems to be two cpu temps one is relative? But which should I look at while stresstesting?
Here's my sensors output:
What is my socket temp? What's my core temp? I have an AMD FX6300 on a ASUS M5A99FX Pro R2.0. I found this but I still don't really get it there seems to be two cpu temps one is relative? But which should I look at while stresstesting?
Here's my sensors output:
Code:
 k10temp-pci-00c3
Adapter: PCI adapter
temp1:        +29.5°C  (high = +70.0°C)
                       (crit = +90.0°C, hyst = +87.0°C)

fam15h_power-pci-00c4
Adapter: PCI adapter
power1:       13.04 W  (crit =  94.99 W)

asus-isa-0000
Adapter: ISA adapter
cpu_fan:        0 RPM

radeon-pci-0100
Adapter: PCI adapter
temp1:        +49.0°C  (crit = +120.0°C, hyst = +90.0°C)

it8721-isa-0290
Adapter: ISA adapter
in0:          +2.77 V  (min =  +2.60 V, max =  +0.19 V)  ALARM
in1:          +2.78 V  (min =  +1.76 V, max =  +3.02 V)
in2:          +1.36 V  (min =  +0.01 V, max =  +0.48 V)  ALARM
+3.3V:        +3.19 V  (min =  +3.46 V, max =  +6.07 V)  ALARM
in4:          +1.73 V  (min =  +0.20 V, max =  +0.70 V)  ALARM
in5:          +2.50 V  (min =  +2.33 V, max =  +1.34 V)  ALARM
in6:          +0.77 V  (min =  +0.08 V, max =  +0.30 V)  ALARM
3VSB:         +4.61 V  (min =  +0.38 V, max =  +3.70 V)  ALARM
Vbat:         +3.26 V
fan1:        1333 RPM  (min =   39 RPM)
fan2:        675000 RPM  (min =  131 RPM)
fan3:           0 RPM  (min =   12 RPM)  ALARM
temp1:        +43.0°C  (low  = +103.0°C, high =  +6.0°C)  ALARM  sensor = thermistor
temp2:        +35.0°C  (low  = -79.0°C, high = -42.0°C)  ALARM  sensor = thermistor
temp3:       -128.0°C  (low  = -85.0°C, high = -75.0°C)  sensor = disabled
intrusion0:  OK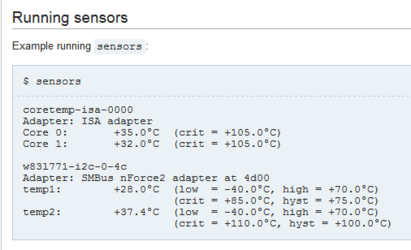
")