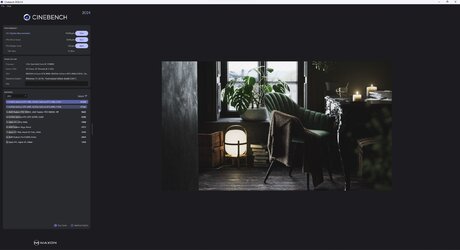
I ran it on my 5800X3D & RX 6800 XT. Looking at @freeagent score, I have room for improvement with the CPU multi core.


Welcome to Overclockers Forums! Join us to reply in threads, receive reduced ads, and to customize your site experience!
Just running my FCLK/MCLK combo at 1933 flat 15s. 255 tRFC, and -25 All Core.. And I was using my Grey FC140I ran it on my 5800X3D & RX 6800 XT. Looking at @freeagent score, I have room for improvement with the CPU multi core.
View attachment 362949
")
Virtualization-Based Security (VBS) is a security feature in Windows 11 that creates an isolated region of memory for security features.What is VBS?
Cheers...Virtualization-Based Security (VBS) is a security feature in Windows 11 that creates an isolated region of memory for security features.
I am running Hynix RAM at 3733 16-19-19, so that is probably the difference. That B-die RAM is some amazing stuff! I tried going from 3733 to 3800 1:1 to improve things, & the board didn't like that & cleared CMOS to get going again. I hope I saved an OC profile on this BIOS version, otherwise I've got to manually retune everything.Just running my FCLK/MCLK combo at 1933 flat 15s. 255 tRFC, and -25 All Core.. And I was using my Grey FC140
Yours looks pretty good
I am running Hynix RAM at 3733 16-19-19, so that is probably the difference. That B-die RAM is some amazing stuff! I tried going from 3733 to 3800 1:1 to improve things, & the board didn't like that & cleared CMOS to get going again. I hope I saved an OC profile on this BIOS version, otherwise I've got to manually retune everything.
In some benchmarks, yes. In this one, not sure.Cheers...
...does it affect the scores???
Freeagent also ran it on his 5800X3D in post #9 and he scored 920 multi-core vs my 5800X3D's score of 883. We are both running -25 on the CPU, but he is running RAM at a higher clock and tighter timings than me. I'm 4-5% slower & IMHO think the RAM could be a part of it.I think freeagent and JLK are pretty close in per core performance. JLK's score is 65% of freeagent's and he has 66% (.6 repeating if you want) of the cores. If anything I maybe would have expected the lower power and clocks to hinder more than the cache helped.
Our RAM difference is more like DDR5-6000 CL34 and 7200 CL30, using your example.So far, minimal differences again, at least between DDR5-6000 CL30 and 7200 CL34.
Sorry. I wasn't clear. I was talking about the RAM I have on hand and tested with. I can't really compare it though as they were on two different mobos.Our RAM difference is more like DDR5-6000 CL34 and 7200 CL30, using your example.

Yeah, stock as in everything in bios on auto - that was my first post in this thread if you look back & No XMP profile. Which also means PBO is auto also in that earlier run. The FCLK on stock auto defaults to 2000, even at 4800MT/S. CPU-Z doesn't want to show it in any of the tabs, I think HWiNFO can show it, can run them again but currently testing an OC on the RAM atm with CL32 for 6400MT/S - which incidentally is pretty rare for Samsung B die ICs without blasting more than 1.40v for VDD through them.Nice! Looks like it went up a few %.
When you said stock, you really meant stock with the ram at 4800 CL40. I would expect a couple of percent increase from that to 6400 CL30.... also wondering if the FCLK had anything to do with the increase. Can't tell what did what without testing each alone.