OP
- Joined
- Jan 27, 2010
- Thread Starter
- #101
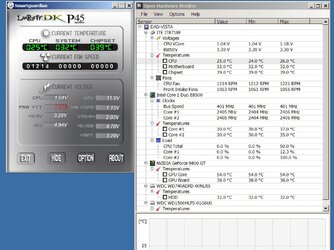
Thx for the feedback RollingThunder. Have you tried the DFI Smartguardian tool for you mainboard?
http://img.lanparty.tw/Upload/Driver/CM/DKP45SG_R2.ZIP
If this works for your board it would be great if you can post a screenshot and an OpenHardwareMonitor.Report.txt created more or less at the same time. This could be usefull if I will start adding more voltages for specific mainboards.
I have just create a new Release Version 0.1.22-beta which adds support for the Winbond W83627THF mainboard sensor chip and the option to start the OHM minimized. Beside a few minor fixes, I have increased the TjMax by 10°C for Intel 65nm CPUs. Earlier I used the last published "TjTarget" values as TjMax. Now TjMax is TjTarget + 10°C which seemd to fit better on some CPUs. Any feedback from the TjMax specialists on this would be great.