Hey Roger...
...There are many tools and views that those of us 1000s of miles away can use to see inside that case of yours. I am going to put up four pics that we like to see in order to estimate what the hey is going on at the other end.
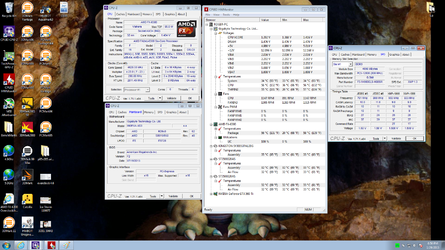
I cannot see the voltages and I cannot see the hard drive temps since the + is not clicked on the menu broken on out. Because we cannot see the voltages we or "I" cannot guesstimate the Vdoop under load and where the LLC might be set on that Giga board. That case is supposed to be a high dollar case and with enough fans in it should nOt have a system temp as high as it is showing. AND a 6300 at 1.4V should not really be at 58c max on the core/package temps. Well at least in my mind I have a bit of wondering. Others may n0t but I do.
Honestly I do not care at all for seeing P95 as a capture. If one wants to fib about it...well so much for that. What we really do need for diagnosis is the 4 captures exactly as shown below. They are open to the things we can look at from Afar to see what is going on up there in ME.
I feel the need to see the real stuff, since it is said around that the Giga boards run hot. Need all the rest of the temps besides the Video card to use as thermal indicator of what is up up there.
RGone...
This is what we need to see for sure and a real good starting point.
Normally during setup and testing we disable C1/E, C6, Cool N Quiet, APM, TurboCore and in windows performance manager itself we set to "performance" mode. ALSO if you have HPC in bios you would ENABLE it. That way there are not "other" settings messing with the overclocking process. Some of those settings are not available on all models of cpu but where in evidence we disable for setup of overclock process.
CPU Tab in CPUz from CPUID com
Memory Tab in CPUz from CPUID com
SPD Tab in CPUz from CPUID com
And this is screen capture of HWMonitor (free version) from CPUID com
HWMonitor has been scrolled enough and large enough to show Min/Max of Voltages and includes the CPU CORE TEMPS / "package" temps fully visible. Latest versions of HWMonitor show the CPU Core Temp as " a Package Temp" and is only shown as a single temp since there were never multple, individual core temp sensors anyway.
This capture is made of HWMonitor after it has been open and running on the desktop logging Min/Max temps and voltages while Prime 95 was running Blend Mode test on all cores for at least 20 mins and then the capture of HWMonitor was made and it shows the Min/Max temps and voltages before P95 Blend was started and while running P95 Blend mode and gives much greater insight into how the system is performing without guessing.
In order to attach screenshots of INDIVIDUAL images as suggested, first crop and capture the images with Snipping Tool found in Windows Accessories or equivalent. Then click on Go Advanced, a button at the bottom of every new post window. Then click on the little paperclip tool at the top of the Advanced post window when it opens. Clicking on the paperclip tool brings up the file browser/upload tool and the rest is fairly obvious.