Hi again folks!
Recently re-built my gaming pc and thought it'd be interesting to finally take an in-depth look at 3D Vision Surround and Widescreen gaming. In particular, wanted to test the following:
- impact of AA/quality settings on overall performance
- pcie 2.0 vs. pcie 3.0
- sli scaling between 2x and 3x 680's
- the penalty associated with using 3D Vision Surround
The short story is that if your motherboard supports pcie 3.0, you should definitely enable it as, on average, it provides a 4% 'free' performance gain. Bear in mind that this only translated to +2.6fps but could be improved with additional overclocking of the cpu, ram and graphic cards.
Going from two to three vga cards increases performance by 33% and enables running higher quality settings at good framerates. Although even two 680's delivered an average of 60 fps at maximum settings (excluding tweaks made through Nvidia Control Panel), adding a third card takes performance from the fringe to more butter-like even at maximum, tweaked settings.
If you're thinking of going 3D Vision Surround, be prepared for the ~50% performance penalty. 3D Vision Surround will take as much muscle as you can throw at it. Even with three gtx 680's, running games with all settings maxed out just isn't happening. Keep that in mind when planning for a new system. Haven't done the research or testing but anyone who says they want a 3D setup 'that can run everything at ultimate, maximum settings', best be ready to shell out the bucks for 3-4 Titans (if anyone has a few, spare Titans they want to send, I'll be happy to test them out if I can keep them hehe). It'll be interesting to see how long it takes for 2-3 mainstream graphic cards to deliver reasonable fps at 5760x1080 with good quality settings and 3d enabled. Also, when looking at non-3D game results, estimate a penalty of 51% or 54% (for 2x or 3x sli, respectively) to get the expected 3D Vision Surround results.
All that said, let's move to the actual testing and results. If you find anything wrong or messed up in my post, please let me know so the issue(s) can be fixed. tia!
Testbed:
i7 3930k @ 4600 GHz
asus rampage iv formula
16g gskill ddr3 2133
samsung 830 256gb ssd
2x 1TB wd black RAID0
3x zotac gtx 680 4gb @ 1202 MHz
3x asus vg278h
cpu/vga watercooling

PCIE 2.0 and enabling PCIE 3.0:
Although the RIVF supports pcie 3.0, enabling it requires edits to the registry. A bit of a pita (and the settings reset whenever the drivers are re-installed) but the fix works without any issues.

Benchmarks:
Aliens vs. Predator http://downloads.guru3d.com/Aliens-vs.-Predator-DirectX-11-Benchmark-Tool-download-2553.html
Bioshock Infinite http://www.bioshockinfinite.com/
Lost Planet 2 http://www.techpowerup.com/downloads/1854/lost-planet-2-benchmark/
S.T.A.L.K.E.R. Call of Pripyat http://downloads.guru3d.com/S.T.A.L.K.E.R-Call-of-Pripyat-benchmark-download-2433.html
Sniper Elite 2 http://downloads.guru3d.com/Sniper-Elite-V2-Benchmark-download-2935.html
Tomb Raider http://www.tombraider.com/
Unigine Heaven 4 http://unigine.com/products/heaven/
Unigine Valley http://unigine.com/products/valley/
Unigine Sanctuary http://unigine.com/products/sanctuary/
OS, drivers, tools, etc.:
Adrenaline Action Benchmark Tool http://benchzone.adrenaline.uol.com.../adrenaline-sleeping-dogs-benchmark-tool.html
AVG anti-virus http://free.avg.com/
FRAPS http://www.fraps.com/download.php
MSI Afterburner http://event.msi.com/vga/afterburner/download.htm
Nvidia GeForce 320.49 http://www.nvidia.com/object/win8-win7-winvista-64bit-320.49-whql-driver.html
Windows 7 SP1 64-bit http://www.microsoft.com
General testing notes:
Unless otherwise noted, all tests were run a minimum of three times to generate each data point and the results were those displayed by the benchmark or tool itself. After compiling the results, outliers and other data points that appeared unreasonable were fully re-tested. If the system became unstable, the Nvidia drivers were re-installed. As/when a driver re-installation did not help, the build was restored using an image created during the initial setup process. The build used included only windows, drivers, the apps/games/tools (including steam) and anti-virus. The general quality settings used include; no AA, 2xAA, maxAA and the maximum settings available via Nvidia Control Panel (NVmax). For a number of applications, 3D Vision Surround limits AA to a maximum of 2x. In those situations, the maxAA results were interpolated using a straight line. Maximum values were used for all other available settings.
The NVmax settings applied include:

The results shown here are based only on the hardware described above and ymmv.
Testing and Results:
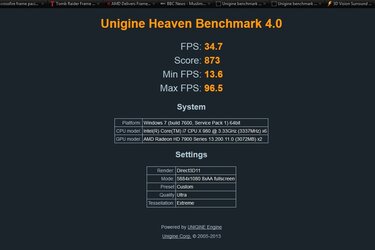
Unigine Heaven 4

For testing, all Heaven 4 settings, except AA, were kept at their maximum values. As noted above, each test ran three times to generate the data points. In the case of any re-testing, the application was again run three times. MaxAA results were interpolated using a straight line. The Heaven 4 results, like the other Unigine apps included here, were very stable with minimal variance across test runs.


As expected, Heaven 4 absolutely crushed the test system. No single test point shows an actual 'playable' setting. This benchmarking app exhibits well above average (12%) gains in moving from pcie 2.0 to pcie 3.0. As shown above, the pcie3/2 gains are most pronounced in tri-sli (16%) particularly in 3D mode (19%). Sli scaling is also above average at 48% while the 3D Vision Surround penalty is slightly above average at 51%.
Unigine Sanctuary
As with the other Unigine benchmarks, all settings, except AA, were kept at their maximum values. Each test ran three times to generate the data points. In the case of any re-testing, the application was again run three times. MaxAA results were interpolated using a straight line. The Sanctuary results, like the other Unigine apps included here, were very stable with minimal variance across test runs.

In contrast to the Heaven 4 results, the test system delivers sufficient horsepower to yield playable results at every setting for non-3D. With 3D enabled, the third card provides the pixels to run the app at good fps. With regard to pcie 3.0 vs. 2.0, the gains are higher using 3 graphic cards. Sli scaling is above average with maximum benefit at pcie3 and 3D off. Sanctuary has the lowest 3D Vision Surround penalty of any application included in this testing (-35%).
Unigine Valley
All settings, except AA, were kept at their maximum values. Each test ran three times to generate the data points. In the case of any re-testing, the application was again run three times. MaxAA results were interpolated using a straight line. The Valley results, like the other Unigine apps included here, were very stable with minimal variance across test runs. Subjectively, Valley looks absolutely gorgeous in 3D.
Valley's another benchmark that brings my system to its knees. The results are very similar to those for Heaven 4. Above average gains from moving to pcie 3.0 with the largest benefit coming from pcie3 with 3D enabled (17%). Valley shows the highest sli scaling of anything tested here at 61.5% when running at pcie3. The 3D penalty is slightly above average at 53%.
Aliens vs. Predator
Perhaps not the best benchmark to include here as there are no user-adjustable settings. AVP testing was run at default and NVmax settings only.

Another game that can run anything non-3D using two cards but requires a third card to generate playable results in 3D. Running three cards yields the greatest percentage gains with pcie3 enabled (8% vs. 3% under pcie2) particularly with 3D disabled (9.5%). AVP has the best sli scaling of any games included here at 35% and although poor in the big picture of things, the third 680 still gives the system enough oomph to run maximum settings in 3D at reasonable levels. The 3D penalty is the expected 50%.
Bioshock Infinite
Pretty cool new game (and it looks nice, too). Testing used the Adrenaline Action Benchmark tool.


For people not running 3d, two 680's can deliver playable framerates at the standard 'High' setting while higher settings requires three cards. For 3D Vision Surround users, get ready for Low settings with some tweaking (NVCP and otherwise) even with three 680's. Once again, the best pcie3 vs. 2 improvement uses the tri-sli configuration. The 3D penalty is worse than average at 53%.
Lost Planet 2
Pretty fun game and 3D looks better than Nvidia's 'Fair' rating. Each test (A and B) within the benchmarking app ran once. Data points were generated from MSI Afterburner log files.

Lost Planet 2 is another game that the 2x-sli, non-3D folks can expect excellent results at all but the best (NVmax) setting but where 3D users get horribly punished. Not sure what's up with the in app quality settings but this game shows the worst performance hit (-49%) going from the max in-game settings to the NVmax setting in non-3D. Pcie3 vs. 2 gains, sli scaling (vs. the other games tested) and 3D penalty were all in line with the averages.
Sniper Elite 2
Another benchmark with no user-adjustable settings.

This games appears to be completely un-playable at 5760x1080 with tri-sli 680's. The three card, non-3D settings showed the best Pcie3 vs. 2 performance improvements. This game scales horrendously (23%) when going from two to three graphic cards. An above average 3D penalty just puts the cherry on top of this one.
S.T.A.L.K.E.R. Call of Pripyat
Ran through the standard benchmark once for each data point and compiled the results from the MSI Afterburner log files. This one gave me some stability issues at the NVmax settings.

Not a lot of surprises here as the results are essentially average. 3D Vision Surround users will need more graphics horsepower to run this one at decent settings. Non-3D users will be fine up to 2xAA (plus a little tweaking with 2 680's or equivalent) or full out maxed with three 680's or better.
Tomb Raider
One of the most boring benchmarks ever seen. That said, some 3D users will undoubtedly smile when they see Lara's swelling breasts.

Another game that shows more or less average numbers and some despair for 3D folks. Interesting that with 3D off, sli scaling reaches a very solid 47%.
Composite Results:
The composites below are comprised of each game and/or application in equal portions unless noted otherwise.
Unigine Composite

Comprised of Heaven 4, Sanctuary and Valley benchmarks. The average framerates in the table are the average of the results for each application and test point. Tri-sli delivered the best pcie3/2 gain, pcie3 the best sli scaling. The 3D penalty reduces significantly at the maxAA setting.
Games Composite
Comprised of the six games. To accommodate variability in quality settings, a simple 1 through 3 plus NVmax quality setting scale was used. As there were only pairs of results for Aliens vs. Predator and Sniper Elite 2, those results were only included in the lowest quality setting (1) and NVmax figures.
Compared with the Unigine Composite results, the Games Composite shows 50% worse sli scaling and a 30% worse 3D penalty. Am not sure but it makes sense to reason that at least part of the reason for the difference is that the folks at Unigine have put a lot more time and effort into tweaking their code for sli scaling and 3D than the game developers. Hopefully the situation improves over time but I'd guess multi-card scaling will get better before 3D support does (based on the niche nature of 3D atm). For now, though 3D Vision Surround gaming at full maximum settings is pretty much out of the question with the hardware equivalent to that used for this testing and may not be attainable with the current generation of hardware with the possible exception of quad Titans.
Overall Results and Conclusion:
Again, to accommodate variability in quality settings a simple 1 through 3 plus NVmax quality setting scale was used.
To wrap it all up, the average expected gain in going from pcie 2.0 to pcie 3.0 is 4% (2.6fps based on what's in the composite). It's not worth upgrading an entire platform but if you can get it working with your current hardware, definitely do so. Tri-sli configurations, particularly with 3D disabled, reap the most performance rewards.
Regarding sli-scaling, the law of diminishing returns definitely comes into play so it's up to people's budgets how far they want to go. Running 3 or more cards provides very nice bang for the buck in that it can allow for higher quality settings and/or make the difference between playable and un-playable at a given setting. Hopefully driver updates and game coding levels improve over time to extract better scaling. Again, tri-(or more)sli configurations running with 3d off at pcie 3.0 gain the most benefits.
For 3D Vision Surround users, the huge 3D penalty can be wallet and/or experience killing if one wants to play with reasonably high graphic settings. That said, my normal gaming experiences are much better than the numbers and quality settings suggest and, imho, is outstanding from an immersion perspective. If you're planning a build from scratch, you may be best off waiting for the next generation of cards. It's interesting that the penalty goes down the higher the AA/quality setting (from -53% at the lowest quality setting to -44% at NVmax).
Best Regards,
-funsoul
PS- As an aside, if you plan on heavy, mmo and/or highly modded widescreen gaming, particularly if running 3D Vision Surround, I'd recommend cards with a minimum of 3GB gddr.
Recently re-built my gaming pc and thought it'd be interesting to finally take an in-depth look at 3D Vision Surround and Widescreen gaming. In particular, wanted to test the following:
- impact of AA/quality settings on overall performance
- pcie 2.0 vs. pcie 3.0
- sli scaling between 2x and 3x 680's
- the penalty associated with using 3D Vision Surround
The short story is that if your motherboard supports pcie 3.0, you should definitely enable it as, on average, it provides a 4% 'free' performance gain. Bear in mind that this only translated to +2.6fps but could be improved with additional overclocking of the cpu, ram and graphic cards.
Going from two to three vga cards increases performance by 33% and enables running higher quality settings at good framerates. Although even two 680's delivered an average of 60 fps at maximum settings (excluding tweaks made through Nvidia Control Panel), adding a third card takes performance from the fringe to more butter-like even at maximum, tweaked settings.
If you're thinking of going 3D Vision Surround, be prepared for the ~50% performance penalty. 3D Vision Surround will take as much muscle as you can throw at it. Even with three gtx 680's, running games with all settings maxed out just isn't happening. Keep that in mind when planning for a new system. Haven't done the research or testing but anyone who says they want a 3D setup 'that can run everything at ultimate, maximum settings', best be ready to shell out the bucks for 3-4 Titans (if anyone has a few, spare Titans they want to send, I'll be happy to test them out if I can keep them hehe). It'll be interesting to see how long it takes for 2-3 mainstream graphic cards to deliver reasonable fps at 5760x1080 with good quality settings and 3d enabled. Also, when looking at non-3D game results, estimate a penalty of 51% or 54% (for 2x or 3x sli, respectively) to get the expected 3D Vision Surround results.
All that said, let's move to the actual testing and results. If you find anything wrong or messed up in my post, please let me know so the issue(s) can be fixed. tia!
Testbed:
i7 3930k @ 4600 GHz
asus rampage iv formula
16g gskill ddr3 2133
samsung 830 256gb ssd
2x 1TB wd black RAID0
3x zotac gtx 680 4gb @ 1202 MHz
3x asus vg278h
cpu/vga watercooling

PCIE 2.0 and enabling PCIE 3.0:
Although the RIVF supports pcie 3.0, enabling it requires edits to the registry. A bit of a pita (and the settings reset whenever the drivers are re-installed) but the fix works without any issues.

Benchmarks:
Aliens vs. Predator http://downloads.guru3d.com/Aliens-vs.-Predator-DirectX-11-Benchmark-Tool-download-2553.html
Bioshock Infinite http://www.bioshockinfinite.com/
Lost Planet 2 http://www.techpowerup.com/downloads/1854/lost-planet-2-benchmark/
S.T.A.L.K.E.R. Call of Pripyat http://downloads.guru3d.com/S.T.A.L.K.E.R-Call-of-Pripyat-benchmark-download-2433.html
Sniper Elite 2 http://downloads.guru3d.com/Sniper-Elite-V2-Benchmark-download-2935.html
Tomb Raider http://www.tombraider.com/
Unigine Heaven 4 http://unigine.com/products/heaven/
Unigine Valley http://unigine.com/products/valley/
Unigine Sanctuary http://unigine.com/products/sanctuary/
OS, drivers, tools, etc.:
Adrenaline Action Benchmark Tool http://benchzone.adrenaline.uol.com.../adrenaline-sleeping-dogs-benchmark-tool.html
AVG anti-virus http://free.avg.com/
FRAPS http://www.fraps.com/download.php
MSI Afterburner http://event.msi.com/vga/afterburner/download.htm
Nvidia GeForce 320.49 http://www.nvidia.com/object/win8-win7-winvista-64bit-320.49-whql-driver.html
Windows 7 SP1 64-bit http://www.microsoft.com
General testing notes:
Unless otherwise noted, all tests were run a minimum of three times to generate each data point and the results were those displayed by the benchmark or tool itself. After compiling the results, outliers and other data points that appeared unreasonable were fully re-tested. If the system became unstable, the Nvidia drivers were re-installed. As/when a driver re-installation did not help, the build was restored using an image created during the initial setup process. The build used included only windows, drivers, the apps/games/tools (including steam) and anti-virus. The general quality settings used include; no AA, 2xAA, maxAA and the maximum settings available via Nvidia Control Panel (NVmax). For a number of applications, 3D Vision Surround limits AA to a maximum of 2x. In those situations, the maxAA results were interpolated using a straight line. Maximum values were used for all other available settings.
The NVmax settings applied include:

The results shown here are based only on the hardware described above and ymmv.
Testing and Results:
Unigine Heaven 4

For testing, all Heaven 4 settings, except AA, were kept at their maximum values. As noted above, each test ran three times to generate the data points. In the case of any re-testing, the application was again run three times. MaxAA results were interpolated using a straight line. The Heaven 4 results, like the other Unigine apps included here, were very stable with minimal variance across test runs.


As expected, Heaven 4 absolutely crushed the test system. No single test point shows an actual 'playable' setting. This benchmarking app exhibits well above average (12%) gains in moving from pcie 2.0 to pcie 3.0. As shown above, the pcie3/2 gains are most pronounced in tri-sli (16%) particularly in 3D mode (19%). Sli scaling is also above average at 48% while the 3D Vision Surround penalty is slightly above average at 51%.
Unigine Sanctuary

As with the other Unigine benchmarks, all settings, except AA, were kept at their maximum values. Each test ran three times to generate the data points. In the case of any re-testing, the application was again run three times. MaxAA results were interpolated using a straight line. The Sanctuary results, like the other Unigine apps included here, were very stable with minimal variance across test runs.


In contrast to the Heaven 4 results, the test system delivers sufficient horsepower to yield playable results at every setting for non-3D. With 3D enabled, the third card provides the pixels to run the app at good fps. With regard to pcie 3.0 vs. 2.0, the gains are higher using 3 graphic cards. Sli scaling is above average with maximum benefit at pcie3 and 3D off. Sanctuary has the lowest 3D Vision Surround penalty of any application included in this testing (-35%).
Unigine Valley

All settings, except AA, were kept at their maximum values. Each test ran three times to generate the data points. In the case of any re-testing, the application was again run three times. MaxAA results were interpolated using a straight line. The Valley results, like the other Unigine apps included here, were very stable with minimal variance across test runs. Subjectively, Valley looks absolutely gorgeous in 3D.


Valley's another benchmark that brings my system to its knees. The results are very similar to those for Heaven 4. Above average gains from moving to pcie 3.0 with the largest benefit coming from pcie3 with 3D enabled (17%). Valley shows the highest sli scaling of anything tested here at 61.5% when running at pcie3. The 3D penalty is slightly above average at 53%.
Aliens vs. Predator

Perhaps not the best benchmark to include here as there are no user-adjustable settings. AVP testing was run at default and NVmax settings only.


Another game that can run anything non-3D using two cards but requires a third card to generate playable results in 3D. Running three cards yields the greatest percentage gains with pcie3 enabled (8% vs. 3% under pcie2) particularly with 3D disabled (9.5%). AVP has the best sli scaling of any games included here at 35% and although poor in the big picture of things, the third 680 still gives the system enough oomph to run maximum settings in 3D at reasonable levels. The 3D penalty is the expected 50%.
Bioshock Infinite

Pretty cool new game (and it looks nice, too). Testing used the Adrenaline Action Benchmark tool.


For people not running 3d, two 680's can deliver playable framerates at the standard 'High' setting while higher settings requires three cards. For 3D Vision Surround users, get ready for Low settings with some tweaking (NVCP and otherwise) even with three 680's. Once again, the best pcie3 vs. 2 improvement uses the tri-sli configuration. The 3D penalty is worse than average at 53%.
Lost Planet 2

Pretty fun game and 3D looks better than Nvidia's 'Fair' rating. Each test (A and B) within the benchmarking app ran once. Data points were generated from MSI Afterburner log files.


Lost Planet 2 is another game that the 2x-sli, non-3D folks can expect excellent results at all but the best (NVmax) setting but where 3D users get horribly punished. Not sure what's up with the in app quality settings but this game shows the worst performance hit (-49%) going from the max in-game settings to the NVmax setting in non-3D. Pcie3 vs. 2 gains, sli scaling (vs. the other games tested) and 3D penalty were all in line with the averages.
Sniper Elite 2

Another benchmark with no user-adjustable settings.


This games appears to be completely un-playable at 5760x1080 with tri-sli 680's. The three card, non-3D settings showed the best Pcie3 vs. 2 performance improvements. This game scales horrendously (23%) when going from two to three graphic cards. An above average 3D penalty just puts the cherry on top of this one.
S.T.A.L.K.E.R. Call of Pripyat

Ran through the standard benchmark once for each data point and compiled the results from the MSI Afterburner log files. This one gave me some stability issues at the NVmax settings.


Not a lot of surprises here as the results are essentially average. 3D Vision Surround users will need more graphics horsepower to run this one at decent settings. Non-3D users will be fine up to 2xAA (plus a little tweaking with 2 680's or equivalent) or full out maxed with three 680's or better.
Tomb Raider

One of the most boring benchmarks ever seen. That said, some 3D users will undoubtedly smile when they see Lara's swelling breasts.


Another game that shows more or less average numbers and some despair for 3D folks. Interesting that with 3D off, sli scaling reaches a very solid 47%.
Composite Results:
The composites below are comprised of each game and/or application in equal portions unless noted otherwise.
Unigine Composite


Comprised of Heaven 4, Sanctuary and Valley benchmarks. The average framerates in the table are the average of the results for each application and test point. Tri-sli delivered the best pcie3/2 gain, pcie3 the best sli scaling. The 3D penalty reduces significantly at the maxAA setting.
Games Composite
Comprised of the six games. To accommodate variability in quality settings, a simple 1 through 3 plus NVmax quality setting scale was used. As there were only pairs of results for Aliens vs. Predator and Sniper Elite 2, those results were only included in the lowest quality setting (1) and NVmax figures.


Compared with the Unigine Composite results, the Games Composite shows 50% worse sli scaling and a 30% worse 3D penalty. Am not sure but it makes sense to reason that at least part of the reason for the difference is that the folks at Unigine have put a lot more time and effort into tweaking their code for sli scaling and 3D than the game developers. Hopefully the situation improves over time but I'd guess multi-card scaling will get better before 3D support does (based on the niche nature of 3D atm). For now, though 3D Vision Surround gaming at full maximum settings is pretty much out of the question with the hardware equivalent to that used for this testing and may not be attainable with the current generation of hardware with the possible exception of quad Titans.
Overall Results and Conclusion:
Again, to accommodate variability in quality settings a simple 1 through 3 plus NVmax quality setting scale was used.


To wrap it all up, the average expected gain in going from pcie 2.0 to pcie 3.0 is 4% (2.6fps based on what's in the composite). It's not worth upgrading an entire platform but if you can get it working with your current hardware, definitely do so. Tri-sli configurations, particularly with 3D disabled, reap the most performance rewards.
Regarding sli-scaling, the law of diminishing returns definitely comes into play so it's up to people's budgets how far they want to go. Running 3 or more cards provides very nice bang for the buck in that it can allow for higher quality settings and/or make the difference between playable and un-playable at a given setting. Hopefully driver updates and game coding levels improve over time to extract better scaling. Again, tri-(or more)sli configurations running with 3d off at pcie 3.0 gain the most benefits.
For 3D Vision Surround users, the huge 3D penalty can be wallet and/or experience killing if one wants to play with reasonably high graphic settings. That said, my normal gaming experiences are much better than the numbers and quality settings suggest and, imho, is outstanding from an immersion perspective. If you're planning a build from scratch, you may be best off waiting for the next generation of cards. It's interesting that the penalty goes down the higher the AA/quality setting (from -53% at the lowest quality setting to -44% at NVmax).
Best Regards,
-funsoul
PS- As an aside, if you plan on heavy, mmo and/or highly modded widescreen gaming, particularly if running 3D Vision Surround, I'd recommend cards with a minimum of 3GB gddr.
Last edited:


") (I'll fix the 4 charts with cosmetic errors tomorrow. update- charts now fixed)
(I'll fix the 4 charts with cosmetic errors tomorrow. update- charts now fixed)