• Welcome to Overclockers Forums! Join us to reply in threads, receive reduced ads, and to customize your site experience!

Overclocking my Phenom II X6 1090T Black Edition

Overclockers is supported by our readers. When you click a link to make a purchase, we may earn a commission. Learn More.
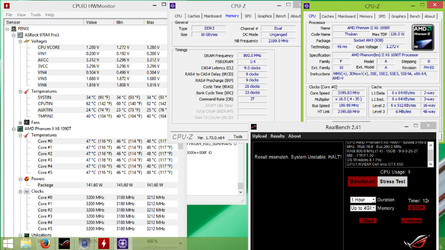
Since nobody at the ROG forum has had any suggestions and since ASRock's tech support basically just suggested I use some other test than MemTest86, I've decided to move on. Maybe there's a multiprocessing bug in the UEFI and maybe it will get fixed, but it doesn't seem to affect anything apart from MemTest86. I don't know if the RealBench stress test issue is related to the MemTest86 issue, but since that's the only stress test I fail - and I fail it even with five of my six cores disabled from BIOS as well as with stock settings - I'm inclined to think it's a software issue. Or maybe it's a GPU issue, who knows...

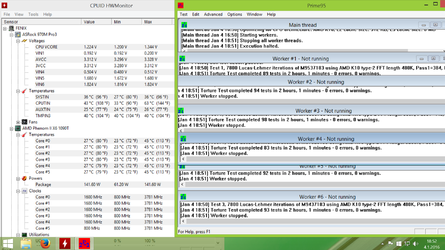
In any case, I've spent some time this week playing with my RAM settings. Seems like my current settings are a keeper, at least at stock voltages and CPU-NB & HT @ 2200 MHz . 8-8-9-25-1T, 1600 MHz and FSB : DRAM 1:4 proved to be MaxxMem2 stable, but failed SuperPi 32M. 8-8-9-25-2T failed Prime95. While 9-9-9-25-1T didn't seem to lead to any errors within an hour or two of testing, I decided to play it safe and keep the CR at 2T. Instead, when I get better case fans and a better CPU fan, I'll bump the CPU-NB and HT up to maybe 2400 MHz. According to MaxxMem2 and AMD OverDrive, this would give me comparable memory performance to running my RAM at 8-8-9-25-1T. Of course, I need to see where I OC my CPU first, since I'll likely bump the non-turbo clock speed up once I improve the cooling. In any case, this just isn't a processor you want to chase memory related HWBOT records with. Someone had OC'd the NB to over 4GHz and had the 4GB of RAM at CL5 or something and still the memory was relatively slow. Luckily RAM speed rarely plays any significant role outside synthetic tests.
 
Hmm. After looking at my options concerning upgrading the CPU cooler, it seems I really only have one if I want to have top-down cooling: Noctua NH-C14S. There are others, but this seems to be the best one - and it should even fit in my mATX case. The "problem" is that the maximum recommended TDP for this cooler is 140 W. My current cooler has a recommended TDP of up to 130 W (and a maximum cooling capacity of 150 W), which means that OC potential would be comparable. Even Noctua's TDP guideline says this cooler has only a low OC potential for my socket type. Of course the main thing at the moment would be to get the socket temps down and the NH-C14S should help in that regard. I don't know how hot my RAM is running, but the design of the cooler should help keep RAM cool as well. Furthermore, the NH-C14S should be even quieter than my current cooler due to the larger fan spinning at a lower RPM, which is a plus. So, even though the cooler is a bit pricey, I'll probably get one once I can afford it.
 
Progress on the RealBench's stress test issue! The maker of the test suggested I ran just the Blender portion through the command prompt and check the SHA-1 hash of the output file. Turns out the hash I get is the wrong one. This is clearly an issue, but here's the catch:

The SHA-1 I get by running Blender is wrong, but it seems to always be the same one.

Since the Blender test as I've ran it only seems to stress the CPU, and not the GPU, this means (I think) that either the CPU is calculating something wrong, transferring data to and from RAM results in a mistake or that writing the resulting image to disk is not done correctly. Mind you, the image seems fine and doesn't contain any obvious errors. It's just that the hash is not correct. Maybe there's a small rounding error somewhere resulting in a slightly different shade of a color or something else not really visible to the naked eye. Whatever it is, it seems to be consistent.

I'm now going to see if I can get the SHA-1 hash to change by changing my system's settings. I already underclocked the GPU and tried underclocking the CPU and CPU-NB/HT to below stock values, but the resulting SHA-1 hash is still the same. RAM is going to be next, but I have a feeling it won't resolve the issue.

Does anyone know if there are known issues with the Phenom II X6 1090T BE that could lead to something like this? I've checked the revision guide for AMD family 10h processors (mine's rev PH-E0, stepping 0), but didn't spot anything I'd instantly recognize as a possible reason - but then again I don't really know this stuff. Or could a RAM incompatibility manifest itself this way? The modules I have aren't officially supported by my motherboard, but so far I've passed the memory tests I've had time to run. Or could it be that I have too tight tRCF timings for my IMC?
 
have you thought about running your ram at 1333, I think that's what the imc is rated at for thuban.
 
I have. I've had an issue with RB's stress test even when everything was stock. For RAM that means 1333 MHz 9-9-9-25-1T if I remember correctly. All SPD values anyways - except for the tRCF, which is set on auto by default and for some reason that means 110. As this is way below the value these modules are supposed to handle, I tried running the Blender with tRCF set to 300 a few minutes ago. That's the lowest value my BIOS allows me to set it to without going below the specs, as the next step down is 160 and for 1333 MHz the SPD value is somewhere around 170. The SPD value for tRCF @ 1600 MHz is 208 (although Kingston's specs say 260), and I've also tried running the Blender also with my normal OC timings for RAM @ 1600 MHz (9-9-9-25-2T amd tRCF "auto" i.e. 110) but with tRCF set to 300. In all cases the result is the same: the SHA-1 hash is the same (and wrong).

Just to make it a bit easier to keep track of the numbers, here are the settings I've tried with Blender:

1333MHz, 9-9-9-25-1T, tRCF 300
1600MHz, 9-9-9-25-2T, tRCF 110 (This is what I use normally; also produces a mismatch in the actual stress test)
1600MHz, 9-9-9-25-2T, tRCF 300

Furthermore, these stock values produce a mismatch in actual the stress test. While I haven't tried the Blender in isolation with these settings, the stress test mismatch might be due to the Blender issue alone:

1333MHz, 9-9-9-25-1T, tRCF 110
 
Unfortunately no. Same goes for my other components. If I had spare parts, finding the issue would be a lot easier, but at the moment I'm stuck with changing settings and seeing if anything helps.

As for the other settings, these also give me the wrong, but same SHA-1 hash (all with RAM @ 1600 MHz 9-9-9-25-2T tRCF 110):

CPU 3200/4000 TC, CPU-NB/HT 2200
CPU 3400/4000 TC, CPU-NB/HT 2200
CPU 2600/no TC, CPU-NB/HT 1800

Temps are well below the maximum values in all cases when running Blender. Even with the OC to 3400 MHz the socket stayed just below 60 C while the CPU stayed below 50 C.

Edit: Voltages are all stock, except for RAM, which I've lowered from 1.585 V to 1.5 V (the official value for my RAM modules). I don't know why the BIOS defaults to a higher voltage for RAM even at 1333 MHz, but even at the higher value the RB's stress test produced a mismatch. I might still try if it affects the SHA-1 hash, but I don't believe instability caused by too low voltage would cause such a consistent error.
 
That seems to be a strange and rather isolated issue that you are having with the RealBench stress test?? Can your system run/pass the RB Benchmark test?

No other issues with other stress tests or all purpose system benchmarks??... Prime95, IBT, OCCT, AIDA64, XTU... Just the ASUS RealBench stress test?

Have you tried or tested your memory kit and combo/setup in Windows using HCI Memtest yet?

Open 6 instances of HCI... One for each core and use Windows Task manager to gauge available memory in Windows. Divide by 6 and enter the same amount of ram for each open HCI. Run/Test multiple passes... ~400% and see if you get any errors. I usually test with HCI at ~92% to ~95% memory usage in Windows via task manager.
 
Can your system run/pass the RB Benchmark test?

Yes. I've run it 10 times in a row with no issues. Even the stress test can be run for hours, it just produces a mismatch every time it finishes a cycle.

No other issues with other stress tests or all purpose system benchmarks??... Prime95, IBT, OCCT, AIDA64, XTU... Just the ASUS RealBench stress test?

I've mostly tested with Prime95 (8 hours stable with 6 workers and 16 GB of RAM). IBT, OCCT and XTU (I thought this was for Intel processors only, though?) I haven't even tried. I'm a bit wary of anything with Linpack as I've heard it'll make the computer run even hotter than Prime95. This could potentially be a problem, since my socket temp peaks at 69 C with Prime95. Aida64 stress test I've run for about 30 minutes with every box ticked (so GPU and SSD stressed as well) and I think I ran every test possible with the AMDOD for a couple of hours. No issues with either program so far, but I could of course run them again for a longer period.

All purpose benchmarks I've run include RealBench 2.4 & 2.41, SiSoftware Sandra Lite 2015, Passmark Performance Test 8.0, Windows System Assesment Tool and GeekBench 3.0 and so far I've had no trouble with any of these with the current settings. Same goes for less comprehensive benchmarks (3DMark & 3DMark11, CPU-Z, Cinebench 15, Unigine Heaven& Unigine Valley).

I have had some issues with higher OCs than the one I have now and I have encountered some occasional (but relatively rare) graphics bugs in DotA 2 Reborn, which may be just due to the Reborn update. I don't remember pre-Reborn having any issues. I also had some graphics bugs appear in the tabs of Firefox while running DotA 2 and other programs in the background, but DotA 2 has apparently had some alt-tab issues as well, so I don't really know what has been the cause. The graphics bugs in any case made me think that maybe the GPU is the cause, but the Blender that produces the false SHA-1 hash doesn't even use the GPU.

Have you tried or tested your memory kit and combo/setup in Windows using HCI Memtest yet?

I hadn't; only with MemTest86 and Windows Memory Diagnostic Tool. However, I am now running 6 instances of HCI as you instructed. I only assigned 2000 MB of RAM each, though, since I wanted to be able to do other stuff as well without Windows going crazy with the paging file. Memory usage at the moment is 85% and all of the six instances have passed the 100% mark with zero errors. I'm going to leave the computer on overnight, which should mean four to six more passes before I'll stop the testing.
 
I just stopped the test a moment ago. Some instances had passed the 600% mark while some where a bit under that and none had found any errors. My next step is running MemTest86 properly (4+ full passes).
 
Your setup seems stable... However it is still kind of odd that your getting that RealBench stress test mismatch result? What does RealBench actually report when it gives you a mismatch? Screenshot? Stock speed or overclocked... Always the same mismatch result?
 
RealBench only reports "Result mismatch. System unstable. HALT!". It has done this at stock settings, at overclocked settings and some underclocked settings I've tried. According to the RealBench developer the mismatch is caused by the Blender's scene render, and is caused (I believe) by the SHA-1 hash not matching the value it is supposed to be. It's not even close. The SHA-1 is supposed to be

"06170F1A3AB84B173B9A4A0CE600945A7F94B7A2"

but I always seem to get

"B057ABE9F6B48CA1C35316B1145064A23F8FDB13",

so it's not that there's just a typo in the hash I received from the developer.

Edit: Here's one 13 minute run with my current settings.
 

Attachments

  • RealBench_mismatch.png
    RealBench_mismatch.png
    210.1 KB · Views: 238
I finally managed to run 4 passes of MemTest86. After 38 hours the results were pretty much what I expected: zero errors.
 
I received some good news. It seems that Blender is indeed doing things slightly differently on my processor, possibly to work around some design errors and mistakes that are specific to this processor revision. This is why the hash is different and why it's consistent. This also means that it's nothing to worry about.
 
I got some improved cooling for my system. A Noctua NH-C14S now cools the CPU and one of the BitFenix Specter's was replaced by an NF-A14. I had some difficulties installing the CPU cooler and I was afraid that the contact between the CPU and the cooler may not be optimal (I'll try to write a longer report in the cooling sub-forum), but everything seemed to work out fine in the end: CPU temp dropped by ~7C and socket temp dropped by ~10C when running P95. Not as much as I'd maybe hoped, but pretty much what could be expected, since the cooler is supposed to be only slightly more efficient than my last one. Also, the top-down blowing desing combined with my mATX case is not optimal considering air flow. In any case, now I have some headroom to experiment with. I already went back to running my system at 3,5GHz/4,0GHz (TC), since I no longer have to worry about the socket going above 70C. The socket is actually staying below 60C now that it's winter and the ambient temperature is lower. For 24/7 use, I need to leave at least 5C headroom unless I wan't to change my settings when summer arrives...
 
I noticed that installing Corsair Utility Engine (I bought a Corsair mouse some time ago) has pushed my system beyond some invisible limit beyond which the Turbo Core mode rarely activates and the motherboard starts feeding the CPU extra voltage. Most of the time when I'm not really doing anything the frequencies switch almost solely between 800 MHz and 3500 MHz (my current OC for the "normal" clock speed), even if only one or two cores are doing something. Vcore stays near 1.35 V most of the time. If I turn off CUE, i start seeing more of the other performance states (800 MHz, 1600 MHz, 2400 MHz, 3500 MHz, 4000 MHz) and Vcore stays mostly near 1.2 V. As a result, idle temperatures drop by about 4 C/2 C (CPU/socket). Under full load everything seems to be as before, and in practice the effect CUE has on performance is negligible in normal use. I only noticed this because I was running a single-thread benchmark and was getting roughly 10% lower results than what I used to get with this setup. So, not a big thing, just a bit odd.

In any case, this got me testing how far I can go with stock voltages. At 3,7 GHz P95 dropped workers very quickly, but 3,6 GHz lasted at least for several minutes. I was just trying to look how the temps behave, so a proper P95 run has to wait. Then again, I might as well try increasing the voltage while I'm at it. Since TC matters even less than it did, there's little point in limiting the OC to it if the temperatures stay in check. I found these numbers on some other site, and will use them as my starting point:


3.20 GHz / 1.325v = Stock Speed & Voltage
3.50 GHz / 1.325v = Max Overclock @ Stock Voltage
3.60 GHz / 1.350v
3.70 GHz / 1.400v
3.80 GHz / 1.45v = Maximum Six-Core Stable Overclock

So 1.350 V first...
 
Seems that I found my heat limit quite quickly. Custom P95 run with 6 workers and 14 GB of RAM pushes my socket temp up to 64 C (I need to leave a margin of at least 5 C) with 1.3875 V and 3.8 GHz. The CPU temp maxed at 46 C, so that's not an issue. Furthermore, the system is still not stable at this voltage and P95 dropped a worker after 15 minutes. With Vcore 1.375 V it took about two minutes for a worker to be dropped, so I don't think I'd need to go all the way up to 1.45 V to get my CPU stable at this speed. However, the next step is to find a stable voltage for 3.7 GHz.

P.S. I didn't have C1E disabled, but I doubt that would make 3.8 GHz stable. If it was only slightly unstable, I might try increasing CPU-NB and HT frequencies, but it doesn't seem like a possible solution now.
 
Two hours of P95 on custom setting (14 GB of RAM) @ 3.7 GHz and 1.375 V. I tried 1.3625 V but it resulted in a dropped worker after twenty something minutes. I'm getting a bit suspicious about those socket temperatures, since the CPU itself is running so cool and I have a top-down blowing CPU cooler nowadays. Maybe the sensor is just not giving reliable readings at higher loads. After all, I'm barely at where the CPU temperature should be somewhat reliable.
 

Attachments

  • OC_3700_1_375V_RAM_1600_NO_TC_NB2200_2h.png
    OC_3700_1_375V_RAM_1600_NO_TC_NB2200_2h.png
    176.7 KB · Views: 182
You still have some green settings enabled, and you WILL need more vcore for your intended clock speed. 1.45v at least. Check your temps then. lol
 
I don't really have anything I'd call an intended clock speed at the moment. 3.7 GHz seems to pose no problem and 3.8 GHz should be within reach. 3.9 GHz? 4.0 GHz? We'll have to see what the VRM section permits. P95 has been now running without errors or warnings for 50 minutes with 3.8 GHz and 1.4 V. Socket temps have maxed at 65 C and CPU temp has maxed at 46 C; at the moment I'm thinking I should just look at what AMD Overdrive gives me as my thermal margin and trust that as long as the VRM doesn't start throttling...
 
Back