• Welcome to Overclockers Forums! Join us to reply in threads, receive reduced ads, and to customize your site experience!

Any reason my collatz conjecture WUs GPU time increased from 7m to 9-12m each?

Overclockers is supported by our readers. When you click a link to make a purchase, we may earn a commission. Learn More.

techiemon

Member
Joined
Jan 29, 2007
Hi guys, I crunch. I use my GPU: ASUS Strix-RTX2060-06G Gaming to do Collatz Conjecture. On July 20th I started noticing that the WUs were taking significantly longer to finish. They went from about 7 minutes to 9-12 minutes to finish. I have posted messages to the board, but people are kinda clueless and the management of the Boinc project usually doesn't reply. I am not sure if the WUs changed or my GPU just suddenly decided it was going to start sucking at doing computations. Is there anyway to tell if my graphics card has been damaged somehow?

Temps run between 57-65C. No AC at night but never over 65C. I run my system now at 60% CPU and 45% of CPU time to keep the temperatures under 80 degrees at night. Daytime I run the system at 90-100% with AC on.

Win 10 updated recently... Might have caused it? I have rebooted. I have removed the project from BOINC and readded it. I have updated the driver of my GPU that was updated on July 9th, but the change started happening on July 20. I have opened the system to blow dust out, there was not much.

Around the same time I also noticed my RGB lighting on the graphics card started to move faster. I have it set to rainbow, the slowest speed usually is quite slow, but it started moving quite a bit faster. I went in, tried to adjust it, but to no avail. I have to say Asus Aurora kinda sucks anyway. The MB on/off RGB control doesn't work, and having done some research I am not alone and have given up, so I am not sure this has anything to do with the GPU performance.

Edit: I tested it with PrimeGrid also and the credits per day would be half now, which means it is taking double the amount of time to finish one WU, something is very wrong.

Thanks
 
Last edited:
You can run UserBenchmark to see how your card is comparing to other cards of the same model in terms of performance. They have an app you download and it will run a benchmark.
 
I'd stay away from userbenchmark... it isn't consistent and scores are wonky... no thanks.... especially for this activitiy.

I don't know an applicable test for what you are running, but I wold run the normal 3D tests (3DMark, Unigine Superposition, etc) and see how it compares. A complete system test and userbench being jenky on top of it, won't lead you to an answer.
 
You could also roll back the recent Windows 10 update and video card driver updates to see if either of those is responsible. Do one of those at a time so you would be able to tell which one if either is the culprit. I think you have 30 days from time of a feature update (the big ones that come once or twice a year) to roll it back. Smaller monthly updates I believe can simply be uninstalled through Windows Settings. Since these are the only things that have changed recently I would start there.

Also, are you using the latest Nvidia driver supplied by Microsoft updates or the latest Nvidida driver offered by Nvidia? The former lags behind the latter.
 
Last edited:
I'd stay away from userbenchmark... it isn't consistent and scores are wonky... no thanks.... especially for this activitiy.

I don't know an applicable test for what you are running, but I wold run the normal 3D tests (3DMark, Unigine Superposition, etc) and see how it compares. A complete system test and userbench being jenky on top of it, won't lead you to an answer.

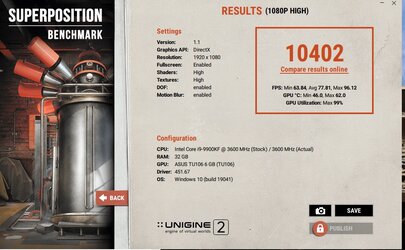
Here are the results for Unigine Superposition, it took 30 minutes to download it. But honestly I don't know what the score really means....

Score comparison but I am not a registered user so my score is not listed, but if it was, it would be on the second page. 10402 was my score. Good, bad??? How do I know what the GPU CPU is doing, this is only for video check no? I have no idea what I am looking at...

https://benchmark.unigine.com/leade...1fe2902c2&utm_campaign=superposition_1.1.8628


2020-07-27 23_26_00-.jpg


Not rolling back Win 10 trents, you know anything to do with Windows that is unecessary could end up causing problems, so not going there. video card available update was on July 9, problem started on July 20, did not install driver update until July 26. So no need to uninstall it.

Is there any possibility that my card is somehow damaged?
 
Register to see it?

Run 3DMark and compare results?

Many ways to skin this cat.

You have to buy a license for your benchmark to be added. I tried to upload it and that was the message I got.

As for 3DMark, it seems I need to pay about 60 bucks to use it. Maybe I am on the wrong site, let me try again.
EDIT Yep, not free, need 19.99, not going to do that for a one time use. Send me a link to the download you are talking about, I must be missing something.
 
https://www.guru3d.com/files-details/3dmark-download.html

The free version doesn't have all tests... but it should run Firestrike and Time Spy. You can then compare against other cards (be sure the CPU is similar as well).

It's downloading, slooooooooooooooooooooooooowly.

But what if anything am I supposed to be looking at with the numbers? Compare to others?

I did something basic, I opened up the task manager, and checked on GPU utilization and it is interesting. Why is GPU utilization only at 8-16%, and GPU RAM only using 2GB out of 22GB? Is this normal for GPU project tasks?
 
You're comparing the results of your GPU with other like GPUs/Systems to make sure it is performing properly.

I don't BOINC and have no idea what collatz conjecture is... so I really can't say with any certainty what you are seeing is normal or otherwise.

GPU utilization in games should be at 99% in most cases (where it isn't being bottlenecked by something else like a CPU or low resolution). I also do not know of a consumer GPU that has 22GB of RAM. I'm assuming you are using the RTX 2060 in your signature which only comes with 6GB. No clue where it is getting 22GB from... again, I don't use the application... just trying to see if it is performing properly in gaming etc first as if it works fine in games, it should work fine on this.
 
From the descriptions, it doesn't sound like either project has made an intentional change to the units, as others would have noticed and commented to that effect.

A quick look at my own task manger for GPU readings, shows dedicated and shared ram. Dedicated seems to match the GPU physical ram. The shared ram is bigger, presumably includes system ram in some way.

Anyway, I'd suggest while doing some of these compute tasks, look at the monitoring tab of GPU-Z. Take a shot of it and post it here. Allow the GPU to warm up before doing so, so we can see the steady state running condition. Have a look at CPU usage while you're at it. Unlike gaming, some GPU compute tasks can also use a significant amount of CPU time, and the PCIe bandwidth makes more of a difference. While I do run PrimeGrid a lot myself, I tend to focus on the CPU projects so I don't have as much experience on the GPU side, and don't have a similar model to do a more direct comparison. I would comment, on PrimeGrid GPU tasks, Turing performs much better than Pascal if you take their relative gaming performance for reference.
 
I'd stay away from userbenchmark... it isn't consistent and scores are wonky... no thanks.... especially for this activitiy.

I don't know an applicable test for what you are running, but I wold run the normal 3D tests (3DMark, Unigine Superposition, etc) and see how it compares. A complete system test and userbench being jenky on top of it, won't lead you to an answer.
There is literally no single better resource online for comparing the performance of individual components to others. It's the literal gold standard in benchmarking for comparing performance of an entire system. I've found it to be extremely consist and accurate across multiple platforms and I have used it extensively. For specific systems, Superposition is the standard for GPU but it's hard to compare how your hardware is doing to others. User Benchmark can let you see how everyone else is doing compared to you with the same hardware. No other resource offers that for ALL components of a computer.

Anyway, it looks like you have an issue. All of your hardware is performing below average which is strange. Your GPU test was incomplete. Try it again. Is it giving you an error message or something? Not sure why the test would come back incomplete.
 
Last edited:
There is literally no single better resource online for comparing the performance of individual components to others. It's the literal gold standard in benchmarking for comparing performance of an entire system.
Literally...eh?

I've found, in my limited use, that drive testing (both SSD and USB) have been inconsistent compared to other storage benchmarks. RAM too. At another forum, someone posted up this benchmark (and some jenky, did not make sense at all rules, lol) to run and others were having issues with it too wondering about its scoring. Many enthusiasts shy'd away from this... especially after this issue popped up last year...

(~25 mins in + is a good summary - watch to the end). If you don't want to watch it... here are some quotes... :)

"it's not that the website is now bad (because of its changes)... it was never good".

'should not be a resource for buying decisions...it's just not accurate'

"our audience isn't the audience that uses userbenchmarks.com" seriously anyway (inferring that enthusiasts are aware this isn't a good test but is for 'potatos')


https://forums.tomshardware.com/thr...seen-by-millions-of-uninformed-users.3591620/


Anyway... sorry about the OT. I just take userbenchmark with a large grain of salt, considering. :thup:
 
Last edited:
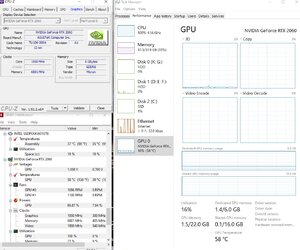
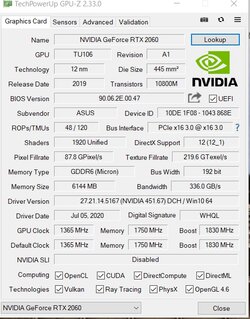
Hi all, ok so I have run all the tasks above as requested. I cranked up CPU usage to 100% for the resource manager and CPU-Z screen shot.

And ED, yeah, it is not 22GB, it was a mix of shared and dedicated that I was looking at.

2020-07-28 10_01_06-Task Manager.jpg

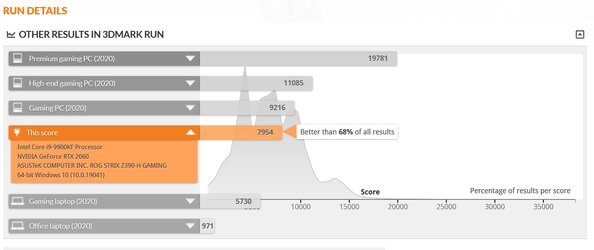
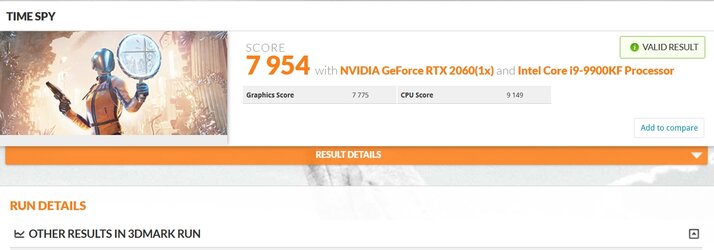
2020-07-28 09_50_18-3DMark Basic Edition.jpg

2020-07-28 09_50_52-NVIDIA GeForce RTX 2060 video card benchmark result - Intel Core i9-9900KF P.jpg

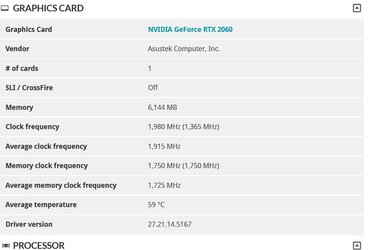
2020-07-28 09_51_26-NVIDIA GeForce RTX 2060 video card benchmark result - Intel Core i9-9900KF P.jpg

2020-07-28 09_51_43-NVIDIA GeForce RTX 2060 video card benchmark result - Intel Core i9-9900KF P.jpg
 
gpuzexample.gif

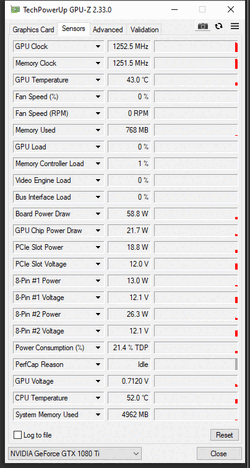
Can we get a GPU-Z screenshot while the compute tasks are running? Example above from my 1080Ti, which is idle. I'd suggest letting it run a while before taking a screenshot so we get some history.

I was also interested in the CPU usage during the compute tasks. In the screenshot provided, the CPU is 100% used. What is it doing? High CPU usage on other tasks can reduce GPU usage. You don't want the CPU to hit 100% while running GPU compute tasks.

Sorry I missed the G, and gave you CPU-Z, I did not know there was a GPU-Z, my brain is a little messed up, got a fever, no not the China Virus.....

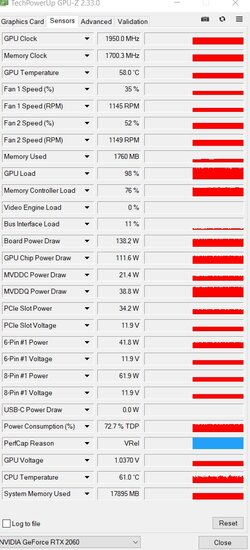
Here is the thing you asked for. Note it should be plenty warm, been running for 8 hours non-stop now.

Note, before this problem, I was running 90-100% with still getting great results from the WUs. So 100% is still fine. I have 16 threads, I run 15-16 WUs, and the GPU project uses very little of CPU time and it never effected anything. Right now, yes, you see 100%, But actually usage was at 90 or 95% at the time of the screenshot, so the GPU has plenty to use. Something changed recently and thus the total credits are less and the total time to do a WU has been increased.

2020-07-28 22_45_33-.jpg

2020-07-28 22_45_56-TechPowerUp GPU-Z 2.33.0.jpg


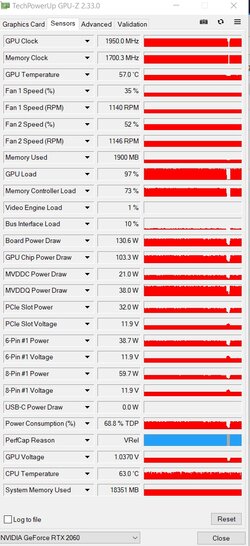
And here is a warmer one yet!


2020-07-28 23_03_27-(2) Daniel Meissner on Twitter_ __Awkward silence_ https___t.co_l9cmpgoUVc_ .jpg
 
Last edited:
Wanted to see what bus loading is like, not even close to limiting. Rest of stuff seems normal enough. If I were in your position, I'd still like to try reducing the CPU loading a bit just to confirm if that helps or not. If it isn't practically sat on 100% it should be ok, but it can help to reduce the variables a bit more.
 
Wanted to see what bus loading is like, not even close to limiting. Rest of stuff seems normal enough. If I were in your position, I'd still like to try reducing the CPU loading a bit just to confirm if that helps or not. If it isn't practically sat on 100% it should be ok, but it can help to reduce the variables a bit more.

I have, and it is the same. At night my PC runs at 60% CPU at 45% of the time. And the result is the same. I am starting to wonder if Collatz just reduced the credits and increased the work time to deter people from running it right now when there are lots of pandemic projects that need crunching power..... The problem is though that I tried Prime Grid also, and the same problem was there. So something is going on.... I wonder if my GPU settings changed somehow....
 
From any of those figures do you feel my GPU could be dying? It is quite new, but that doesn't mean anything...
 
Back